/
The System of Rice Intensification and Its Impacts on House The System of Rice Intensification and Its Impacts on House

The System of Rice Intensification and Its Impacts on House - PowerPoint Presentation

briana-ranney
briana-ranney . @briana-ranney
Follow
417 views
Uploaded On 2015-09-27

The System of Rice Intensification and Its Impacts on House - PPT Presentation

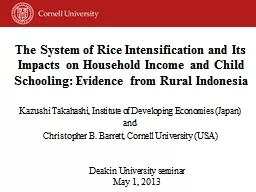
Kazushi Takahashi Institute of Developing Economies Japan and Christopher B Barrett Cornell University USA Deakin University seminar May 1 2013 Motivation SRI as propoor environmentally friendly innovation ID: 142190

income sri household gains sri income gains household level farm rice plot labor impacts yield impact 000 total estimates

Share:

Link:

Embed:

Download Presentation from below link

Download Presentation The PPT/PDF document "The System of Rice Intensification and I..." is the property of its rightful owner. Permission is granted to download and print the materials on this web site for personal, non-commercial use only, and to display it on your personal computer provided you do not modify the materials and that you retain all copyright notices contained in the materials. By downloading content from our website, you accept the terms of this agreement.


Presentation Transcript

Slide1

The System of Rice Intensification and Its Impacts on Household Income and Child Schooling: Evidence from Rural Indonesia

Kazushi

Takahashi, Institute of Developing Economies (Japan)

and

Christopher

B.

Barrett, Cornell University (USA)

Deakin

University seminar

May 1,

2013

Slide2

Motivation

SRI as pro-poor, environmentally friendly innovation:

Nontraditional origins (developed by missionary priest in Madagascar, not in the labs/fields of a research institute)

No purchased or new external inputs needed, less H

2

0 use

Intensive use of labor; the poor commonly have surplus

Controversy within rice community

Repeated observations of large yields gains (50-200%) on farmers’ fields in multiple countries across Africa and Asia, while some experimental trials show

little impact on yield

(

McDonald et al., 2006, 2008).

Weak

theoretical foundation: Science behind

SRI’s yield effects remains unknown; SRI

not

accepted

by some crop

scientists

(“Scientific

U

nconfirmed

F

ield

O

bservations”).Slide3

Motivation

SRI has gained international media/donor attention:Slide4

What are the welfare impacts of SRI?

Amid the scientific disputes about the biology of SRI, the impacts (if any) on farmer welfare and broader economic impacts have been largely ignored.

Widespread adoption but in some places also much

disadoption

too … are users really better off?

On-station experimental trials may not reflect farmers’ realities, while simple with-without comparisons among farmers or over time ignore selection effects and spurious correlation with background trends.

Especially if it requires more labor, must look beyond just partial productivity of land (yield) impacts.

A big knowledge gapSlide5

Our core (as-yet-unanswered) question:

What

impact does SRI have on

household income, including off-farm income generation, and on children’s education?

Use original primary data collected in rural Indonesia to:

Identify the factors associated with SRI use

Use those results to match on observables using propensity score matching (PSM) (w/tests sensitivity to

unobservables)Estimate the impacts of SRI adoption on:yield and rice income/HA at plot level

Farm/off-farm/total incomes, child school enrollment at hh level

Our contributionSlide6

Core findings:SRI indeed

generates big (~64%) yield and plot-level rice income (107%) gains but also demands more

labor, consistent with prior findings.

SRI users have lower off-farm earnings, especially women’s self-employed earnings and as a result have no significant total household income gains

SRI users’ children show no difference in school enrollment patterns

Our contributionSlide7

What is SRI?

SRI

is a systems-based rice production approach/ technology characterized by a suite of agronomic practices and principles:

Early transplanting of young seedlings (8-12 days old)

Shallow planting (1-2 cm) of one or two seedlings

sparse planting density (more than 20 × 20 cm)

intermittent irrigation (alternate wetting and drying)

No new seed, agrochemicals, etc. – and less water –

requiredIt is commonly held that SRI is complex and careful/ timely water management and weed control are required. Thus both higher yields and higher yield risk (Barrett et al.

AJAE 2004).Slide8

Non-SRI

Seedlings

(30 days

after seeding

)

SRI

Seedling

(

10 d

ays

after Seeding

)

Photos by Nippon Koei

What is SRI?Slide9

Wet

Dry

Photos by Nippon Koei

What is SRI?Slide10

Photo by Christine Moser (Madagascar)

What is SRI?

SRI

Non-SRISlide11

Photos by Nippon Koei

What is SRI?Slide12

Impact Evaluation

We want

to know

avg

treatment effect on the treated (

ATT), but it

is

impossible to observe the outcome of

SRI-adopters had they not adopted SRI. So use PSM to match conditional on probability of SRI use, as estimable based on plot- and household-level observable characteristics.But we know that SRI uptake is highly non-random, with >½ of yields gains due to farmer- or plot-specific observables/

unobservables (Barrett et al. AJAE 2004). So (i) try to elicit/control for some

unobservables, (ii) do sensitivity testing using Rosenbaum (2002) bounds and Ichino et al. (2008) methods.Slide13

Data

Jeneponto

District, South

Sulawesi, Indonesia

Poor, agriculture-dependent region

Annual rainfall is limited (1,000 mm-1,500 mm/year)Irrigation project funded by JICASRI promoted under the scheme since 2002

Sample: 864 rice farmers (122 SRI adopters/742 non-adopters), with 1202 rice plots after 2009 wet seasonSlide14

Descriptive Stats 1


Mean

sd

Household Characteristics

# of Cultivated Plots

1.43

0.8

Total Land Size

(ha)

0.64

0.6

Adopt SRI

(%)

14.12

34.8

SRI Experience

(years)

0.71

1.9

SRI

Experience conditional on SRI uptake

(years)

4.31

2.8

Plot Characteristics

Adopt SRI

(%)

13.98

34.69

Young Seedling

(%)

13.64

34.34

Shallow Planting

(%)

13.14

33.80

Parse Planting

(%)

13.56

34.25

Intermittent Irrigation

(%)

11.15

31.49

Full Adoption of SRI

(%)

9.98

29.99Slide15


SRI

Non-SRI

Diff

Plot level

outcomes (

n=168 SRI, 1,034 non-SRI)

Yield

(ton/ha)

5.50

2.95

2.54

***

Rice income per ha

(

Mn

Rp

)

6.67

2.46

4.21***

Household level

outcomes (

n=122 SRI, 742 non-SRI)

Monthly Total Farm income

(000 RP)

732.50

238.80

493.7

***

Monthly Total off-farm labor income

(000 RP)

543.90

503.90

40.06

o/w

Off-farm

wage earnings

(000 RP)

398.10

272.30

125.80

o/w

Self-employed non-farm income

(000 RP)

145.90

231.60

-85.69

Monthly Total labor income

(000 RP)

1276.50

742.70

533.7

***

Descriptive Stats 2

SRI yields +86%, rice income +171%,

hh

income +72% … are these gains attributable to SRI? Slide16

Probit SRI Use Estimates

VARIABLES

Estimate

(SE)

Plot upstream

0.802***

(0.238)

Plot midstream

0.488**

(0.199)

Plot receives water directly from canal

0.947***

(0.222)

Size of plot (ha)

0.243*

(0.141)

Number of plots a household operates

-0.121**

(0.052)

Dummy equal to 1 if a household head is female

-0.823***

(0.294)

Number of HH members age 6 and below

-0.330***

(0.070)

Number of HH members age 15 and above

0.071**

(0.032)

Number of HH members age between 6-14

0.026

(0.073)

At least

one technology advisor ever

adopted

SRI

1.843***

(0.133)

Risk averse

-0.425*

(0.228)

Pseudo R

2

0.379


Table 4. Selected

Probit

Results of SRI Use at Plot Level

Sensible results, although the purpose of this step isn’t causal inference, esp. given prospective

endogeneity

of some covariates.Slide17

Common support check

Distributions of SRI and non-SRI plots are each skewed, so use kernel matching, drop (12) off-support observations.

Post-match, all covariates pass

balancing test at 10%

levelSlide18

Plot-Level ATT Estimates of SRI Use

PSM Impact Estimates

Large yield and rice profit gains, even with added labor use (added cost only ~10% of profit gains at prevailing wage rates).

Even allowing for the possibility of selection-on-

unobservables

, the impacts of SRI use on rice yields, rice income per hectare are clear. But gains in terms of labor use less convincing. Slide19

PSM Impact Estimates

Household-Level Impacts of SRI Use

Farm income gains from SRI use are completely offset by lower off-farm earnings, especially women’s self-employed non-farm income. No household income gains, on average, from SRI.Slide20

PSM Impact Estimates

Despite the increased labor demands of SRI use, children in SRI households are no less likely to attend school and no more likely to be delayed in school progress.

Offsetting income effects of productivity gains and substitution effects on labor demand?

Household-Level Impacts of SRI UseSlide21

We corroborate claims of SRI’s tremendous plot level productivity gains, but also of increased labor demand.

But we find that these productivity gains vanish at household level. SRI seems to induce reallocation of (women’s) time from off-farm self-employment, wiping out income gains at the household level.

Some of those are perhaps invested in keeping children in school in spite of higher returns to family labor on-farm.

Puzzle: where do the productivity gains go? Why only modest (18%)

disadoption

? Adopters capture gains in non-monetary form (esp. locational preferences for work).

ConclusionsSlide22

Thank you for your time, interest and insights

Thank you!