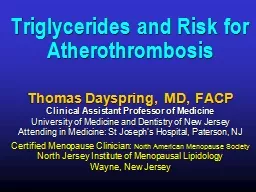
Thomas Dayspring MD FACP Clinical Assistant Professor of Medicine University of Medicine and Dentistry of New Jersey Attending in Medicine St Josephs Hospital Paterson NJ Certified Menopause Clinician ID: 690975
Download Presentation The PPT/PDF document "Triglycerides and Risk for Atherothrombo..." is the property of its rightful owner. Permission is granted to download and print the materials on this web site for personal, non-commercial use only, and to display it on your personal computer provided you do not modify the materials and that you retain all copyright notices contained in the materials. By downloading content from our website, you accept the terms of this agreement.
Slide1
Triglycerides and Risk for Atherothrombosis
Thomas Dayspring, MD, FACP
Clinical Assistant Professor of Medicine
University of Medicine and Dentistry of New Jersey
Attending in Medicine: St Joseph’s Hospital, Paterson, NJ
Certified Menopause Clinician:
North American Menopause Society
North Jersey Institute of Menopausal Lipidology
Wayne, New JerseySlide2
Fredrickson-Levy-Lees Classification of Hyperlipoproteinemia
Pharmacotherapy 4th Edition.p. 353
Phenotype
Occurrence
Lipoprotein
Present in
Excess
Chol
Trig
IIA
Common
LDL
>250
<150
IIB
Most common
LDL,VLDL
>250
150-400
III
Rare
VLDL remnants
375-500
600-800
IV
Common
VLDL
225-275
375-500
VLDL
I
Rare
Chylomicrons
250-400
>2500
V
Rare
Chylomicrons,
350-400
1700-2500Slide3
Triglycerides - Triacylglycerol
Triglycerides are water-insoluble lipids consisting of
three fatty acids linked to one glycerol molecule.
They represent a concentrated source of metabolic energy contributing 9 kcal/gm.
TG are transported as
core constituents of all lipoproteins, but the greatest concentration is in TG-rich
chylomicra
and VLDL particles
Rafai, N et al. Handbook of Lipoprotein Testing AACC Press Washington DC 2nd Ed 2000
R = Fatty acid chain
H
2
C-O-C-
R
1
║
O
H
2
C-O-C-
R
3
║
O
HC-O-C-
R
2
║
OSlide4
Triacylglycerol - Triglyceride
Palmitic
acid, oleic acid, alpha-
linolenic
acid
Chemical formula: C
55
H
98O
6
O
O
O
O
O
O
H
2
C
H
2
C
HC
*
α
9
ω
or
n
12
15
Palmitic
acid
Oleic acid
α
-
linolenic
acid
3
1
1Slide5
N
ational
C
holesterol
E
ducation
P
rogram
A
dult
T
reatment P
anel III NCEP-ATP III
Risk of Triglycerides
Several causes underlie elevated Triglycerides in the general population
Overweight and obesity
Physical inactivityCigarette smoking
Excess alcohol intakeVery high carbohydrate diets (>60% of energy)
Other disease (diabetes, renal failure, nephrosis)
Drugs: steroids, protease inhibitors, estrogen, etc
Genetic factorsNCEP JAMA 2001;285:2486 Final Report Circulation 2002;106:3143-3421Slide6
N
ational
C
holesterol
E
ducation
P
rogram
A
dult
T
reatment P
anel III NCEP-ATP III
Elevations of TriglyceridesNCEP JAMA 2001;285:2486 Final Report Circulation 2002;106:3143-3421
In persons with none of these factors, serum
triglyceride levels typically are
less than 100 mg/dL.
As some of these triglyceride-raising factors develop, levels commonly rise into the range of 150 to 199
mg/dL. Although several factors can elevate triglycerides most common are overweight/obesity and physical inactivity
When triglyceride rise to ≥200 mg/dL
, genetic influences play an increasing role as well.Slide7
Risk Classification of Serum Triglycerides
Normal <150 mg/dL
Borderline high 150–199 mg/dL
High 200–499 mg/dL
Very high
500 mg/dL
N
ational
C
holesterol
E
ducation
P
rogram
Adult
Treatment
Panel
III NCEP-ATP III Risk of Triglycerides
NCEP JAMA 2001;285:2486 Final Report Circulation 2002;106:3143-3421Slide8
Normalize LDL-C
130 mg/dl in moderate risk patients (10-20% 10 year risk)
<100 mg/dl in high risk patients (>20% 10 year risk)
Hypertriglyceridemia
NCEP ATP III Chapter VI pp25-26
N
ational
C
holesterol
E
ducation
P
rogram
A
dult
T
reatment P
anel III NCEP-ATP III
Goals of TherapySlide9
N
ational
C
holesterol
E
ducation
P
rogram
A
dult
T
reatment P
anel III NCEP-ATP III
Risk of Triglycerides: Lipoprotein Remnants
Renewed interest in the importance of elevated triglycerides has been stimulated by the publication of meta-analyses that found that raised triglycerides are in fact an independent risk factor
for CHD.
This independence suggests that some triglyceride-rich lipoproteins (TGRLP) are atherogenic.
The most likely candidates for atherogenic TGRLP are remnant lipoproteins. These lipoproteins include small very low density lipoproteins (VLDL) and intermediate density lipoproteins (IDL). They are cholesterol enriched particles and have many of the properties of LDL.
NCEP JAMA 2001;285:2486 Final Report Circulation 2002;106:3143-3421Slide10
N
ational
C
holesterol
E
ducation
P
rogram
A
dult T
reatment P
anel III NCEP-ATP III
Elevated Triglycerides
Some species of triglyceride-rich lipoproteins, notably, cholesterol-enriched remnant lipoproteins, promote atherosclerosis and predispose to CHD.
Evidence statement
NCEP JAMA 2001;285:2486 Final Report Circulation 2002;106:3143-3421
Recommendation:
In persons with high serum triglycerides, elevated remnant lipoproteins should be reduced in addition to lowering of LDL cholesterol.Slide11
When
triglyceride levels are ≥200 mg/dL
, the presence of increased quantities of
atherogenic remnant lipoproteins
can heighten CHD risk
substantially
beyond that predicted by LDL cholesterol alone.
For these reasons,
ATP III modified the triglyceride classification
to give more attention to moderate elevations.
NCEP ATP III Chapter II Circulation December 2002 pp3169
N
ational
C
holesterol
Education
Program
A
dult
Treatment
Panel
III NCEP-ATP III Risk of TriglyceridesSlide12
NCEP ATPIII. Chapter IV
Circulation December 2002 pp 3247
N
ational
C
holesterol
E
ducation
P
rogram
A
dult
Treatment
Panel III NCEP-ATP III
Treatment of Triglycerides
If triglycerides are
very high (≥500 mg/dL),
attention turns first to prevention of acute pancreatitis, which is more likely to occur when triglycerides are >1000 mg/dL. Triglyceride-lowering drugs
(fibrate or nicotinic acid)
become first line therapy; although statins can be used to lower LDL cholesterol to reach the LDL goal, in these patientsSlide13
What is the NCEP ATP III
goal for TG therapy,
if baseline TG is 200-500 mg/dL?
Normalize LDL-C
Normalize the non HDL-C value
N
ational
C
holesterol
E
ducation
P
rogram
A
dult T
reatment P
anel
III NCEP-ATP III Treatment of Triglycerides
1)
2)
↓
ApoB
NCEP JAMA 2001;285:2486 Final Report Circulation 2002;106:3143-3421Slide14
N
ational
H
ealth
A
nd N
utrition Examination Survey (
NHANES) Lipid Changes 1976 - 2006
Cohen J, et al. Circulation AHA Scientific Sessions 11/2008 New Orleans
10%
5%
0
0
40%
45%
2.4
1.8
2.3
3.5
5.5
8.7
43.5
47.7
43.2
40.1
40.6
Abnormal TG
Abnormal LDL-C
NHANES II 1976-1980
NHANES III 1988-1994
NHANES 1999-2006
N = 4,719
N = 6,119
N = 7,620
Age 20-74
Age 60-74
42.3
2X
5XSlide15
PRO
spective
CA
rdiovascular
M
unster Study (PROCAM): Hypertriglyceridemia
Events/1000 in 8 years
Assman, G et al., Am J Cardiol 1992;70:733-737
(157/3593) (84/903) (14/106)
TG (mg/dl)
0
20
40
60
80
100
120
140
<200
200-399
400-799
>800
44
93
132
81
(3/37)
An Independent Risk Factor For CADSlide16
PR
ospective
CArdiovascular M
ünster Study
(PROCAM) Risk of CHD by Triglyceride Level
Elevated triglyceride levels significantly increase CHD risk
Significant correlation remains between triglyceride level and CHD risk after adjustment for LDL-C and HDL-C
6-fold increased CHD risk in patients with triglycerides >200 mg/dL and LDL-C:HDL-C >5
8-Year Follow-Up
*
P
<.01
Assmann
, et al. Am J Cardiol. 1996;77:1179-1184.
Relative CHD Risk
Triglyceride Level, mg/dL
<105
105-166
>166
*
*
1.6
2.6
N = 4639 men with no
history of MI or strokeSlide17
Risk of CHD by Triglyceride Level
The Framingham Heart Study
N = 5127
Castelli WP.
Am J Cardiol.
1992;70:3H-9H.
Relative CHD Risk
Triglyceride Level, mg/dL
0
0.5
1
1.5
2
2.5
3
50
100
150
200
250
300
350
400
Men
WomenSlide18
Risk of CHD by Triglyceride Level:
The Framingham Heart Study
Women
Castelli WP.
Am J Cardiol.
1992;70:3H-9H.
n=5,127
Triglyceride level (mg/dL)Slide19
Hypertriglyceridemia as a Risk Factor
for CHD in Men With IGT or Diabetes
Fontbonne A et al.
Diabetologia. 1989;32:300-304.
*
Risk of CHD death
significantly (
P
<0.01) increased in subjects with triglyceride level above this point.
No CHD death (n=917)
44
88
177
354
708
*
//
0
10
20
30
Log scale TG (mg/dL)
Percentage of subjects
CHD death (n=26)Slide20
Paris Prospective Study: 11 Year Follow-up Hypertriglyceridemia as a Risk Factor for CHD in Male Patients with Diabetes or IFG
% of Patients
*
0
10
20
30
No CHD death (n=917)
Log-scale TG (mg/dL)
CHD death (n=26)
44
88
177
354
708
*Risk of CHD death significantly (
P
<0.01) increased with TG level* >133 mg/dL.
Fontbonne et al.
Diabetologia.
1989;32:300.Slide21
Paris Prospective Study: 11 Year Follow-up Hypertriglyceridemia as a Risk Factor for CHD in Male Patients with Diabetes or IFG
Fontbonne et al.
Diabetologia.
1989;32:300.
0
2
4
6
0
2
4
6
Annual Coronary Heart Disease mortality per 1000
Cholesterol
≤ 230 > 230 ≤230 > 230
Triglyceride
≤ 111 > 111
FI
≤ 100 > 100 ≤ 100 >100
TG
≤ 111 > 111Slide22
- Helsinki Heart Trial - Triglyceride, HDL-C and Risk for CAD
Circulation 1992;85:37-46
LDL-C:HDL-C <5.0
LDL-C:HDL-C >5.0
Triglycerides mg/dl
Incidence of cardiac events per 1000 patient years
0
5
10
15
20
25
30
<200
>200
<200
>200
Gemfibrozil
Placebo
45%Slide23
- Helsinki Heart Trial - Triglyceride, HDL-C and Risk for CAD
Circulation 1992;85:37-46
LDL-C:HDL-C <5.0
LDL-C:HDL-C >5.0
Triglycerides mg/dl
Incidence of cardiac events per 1000 patient years
0
5
10
15
20
25
30
<200
>200
<200
>200
PlaceboSlide24
- Helsinki Heart Trial - Effects of Gemfibrozil
Circulation 1992;85:37-46
LDL-C:HDL-C <5.0
LDL-C:HDL-C >5.0
Triglycerides mg/dl
Incidence of cardiac events per 1000 patient years
0
5
10
15
20
25
30
<200
>200
<200
>200
Gemfibrozil
Placebo
45%Slide25
The Baltimore Coronary
O
bservational
Long-Term Study
According to standard baseline risk factors
What is the prevalence
without
new CAD event after 18 years
Miller, M J Am Coll Cardiol 1998;31:1252-7
N=740 with angiographic CHD at baselineSlide26
The Baltimore Coronary
O
bservational
Long-Term Study
Baseline Triglyceride Quartiles (mg/dl)
Prevalence
without
New CAD Event
Miller, M J Am Coll Cardiol 1998;31:1252-7
*p=0.002
*
I
III
II
IV
N=740 with angiographic CHD
<100
101-134
135-186
>187Slide27
The Copenhagen Male Study
Tertile of Triglyceride leve
l
Adjusted for
Age
Body mass index
Alcohol use
Smoking
Physical activity
Hypertension
Type 2 diabetes
Social classLDL-C
HDL-C
Compared to Lowest Tertile
<88 mg/dl
89-139 mg/dl
>140 mg/dl
Circulation 1998;97:1029-36
2906 men free of CVD 8 year follow up 229 men had first CHD event
For the trend
p
>0.001
50%
120%Slide28
0
5
10
15
20
Intermediate Group
High TG - Low HDL-C Group
Low TG - High HDL-C Group
(n=30/247)
(n=40/327)
(n=56/876)
(n=79/927)
(n=15/347)
(n=9/181)
P
=.01
170 mg/dL
>
170
mg/dL
LDL-C Level
Copenhagen Male Study
Combination of High Triglyceride and Low HDL
Jeppesen, et al.
Arch Int Med.
2001;161:361.
IHD, %Slide29
Copenhagen Male Study
Risk
of Ischemic Heart Disease (IHD) Associated With Higher TG and Lower
HDL-C
Jeppesen J, et al.
Circulation.
1998;97:1029-1036.
3
9
5
1
6
8
7
8
1
1
8
2
17
0
1
2
3
Adjusted for all possible confounders
Relative
Risk for IHD
HDL-C, mg/dL
TG, mg/dL
Follow-Up N=2906Slide30
S
tockholm
HE
art
E
pidemiology
P
rogram
Risk Factors for Nonfatal MI in Men and Women
Reuterwall C et al.
J Intern Med. 1999;246:161-174.
Diabetes
High TC
(
6.5 mmol/L)
High TG (6.3 mmol/L)
HTN (170/95 mm Hg)
Overweight (BMI 30 kg/m²)
WHR (0.85)
Physical inactivity
Smoking
Job strain
Men
Women
0
1
2
3
4
5
6
7
8
Odds Ratio
Risk Factor
SHEEPSlide31
CAD Risk in E
uropean
C
oncerted Action on Thrombosis (ECAT
)-Angina Pectoris Study
Tertiles of Apo A-I
Tertiles of Triglycerides
Thromb Haemost 2000;84:955-960
Odds Ratio for CV Events
1.6
1.0
1.3
0
1
2
3
4
5
6
Lower
Middle
Higher
Lower
Middle
Higher
2.6
3.5
5.7
3.9
2.3
1.6
1.6
1.0
1.3Slide32
Applying Clinical Trial Results To The General Population
4 Primary Prevention Trials
LRC-CPPT, Helsinki, WOSCOPS, AFCAPS-TexCAPS
19-37% reductions in risk of first coronary event
Inclusion criteria: high risk lipid profilesOnly AFCAPS included women
Arch Intern Med 2001;161:949-954
Framingham Heart Study
included 2498 men and 2870 women age 34-75, free of CHD
Only
60% of these men and 20%
of the women had cholesterol elevations which would have qualified them for the above studies. Slide33
Framingham Heart Study
40%
of presumably healthy men and
80% of women
aged 30-74 in Framingham Heart Study had lipid profiles that were not considered serious enough to study in
any
primary coronary prevention clinical trials to date.
In general subjects with
desirable or average cholesterol
and lower, average or high HDL-C have not been included in clinical trials
Lloyd-Jones D, et al. Arch Intern Med 2001;161:949-954Slide34
Framingham Heart Study
In other words,
40%
of presumably healthy men and
80% of women
in Framingham Heart Study had lipid profiles that were not considered serious enough to study in any primary coronary prevention clinical trials to date.
Unfortunately, a large number of these “ineligible” patients with minor lipid abnormalities went on to develop CHD events.
Arch Intern Med 2001;161:949-954Slide35
Framingham Heart Study
Unfortunately, many (
11% of the 2498 men
and
4.7% of 2870 women
) of these “ineligible” patients with minor
LDL-C abnormalities went on to develop CHD events.
Arch Intern Med 2001;161:949-954Slide36
Framingham Heart Study
Among subjects in
Framingham
who developed incident CHD during a 12 year follow-up:
Arch Intern Med 2001;161:949-954
The
MAJORITY
(66%)
of the women25% of the men
Did not have an elevated LDL-C that would have qualified for any primary prevention lipid trial ever done
MAJORITYSlide37
Framingham Heart Study
Arch Intern Med 2001;161:949-954
Isolated hypertriglyceridemia
(>200 mg /dl)
Elevated TG and low HDL-C
What was the
most common lipid abnormality
in these patients who developed CHD ?Slide38
Applying Trials To The General Population
Therefore, many men and
most
women with heart disease have lipid problems other than high total or LDL cholesterol that put them at risk for heart disease.
This landmark study shows us that there is no cutoff cholesterol number below which coronary heart disease cannot develop.
Edward F Gibbons MD
Editor of New England Journal Medicine Heart Watch June 2001 Vol 5 #5 p3Slide39
Women’s Health Study
Fasting versus Nonfasting Triglycerides
Association of TG with Future CV Events Stratified by Time from Last meal
Time from last meal, hrs
# patients
# Events
Hazard ratio (95% CI)
2 - < 4
4 - 8
8 - 12
≥ 12
2707
2504
4846
15272
08
02
177
600
4.48 (1.08-10.15)
1.50 (0.72-3.13)
1.31 (0.73-2.36)
1.04 (0.70-1.36)
Fully adjusted HR (95% CI)
10
1.0
0.5
HR for highest
(> 147)
vs lowest tertiles
(
≤ 90)
of TG levels adjusted for age, BP, smoking, hormone use, tertiles of total and HDL-C, DM, BMI & hs-CRP
0.5
1.0
10
Fully adjusted HR
0.5
1.0
10
Fully adjusted HR
0.5
1.0
10
Fully adjusted HR
Myocardial Infarction
Ischemic Stroke
Revascularization
CV Death
All CV Events
Fasting
Nonfasting
Fasting
0.5
1.0
10
Fully adjusted HR
HDL-C
≥ 50 mg/dL
TG < 150 mg/dL
TG
≥
150 mg/dL
Association of TG with Individual CV Endpoints according to fasting status
Association of High vs Low TG levels with future CV events stratified by HDL-C level
HR using TG levels < 150 and HDL-C levels
≥ 50 mg/dL
adjusted for age, BP, smoking, hormone use, tertiles of total and HDL-C, DM, BMI & hs-CRP
Bansal, S et al. JAMA. 2007;298:309-316
TG < 150 mg/dL
HDL-C
< 50 mg/dL
Nonfasting
TG
≥
150 mg/dLSlide40
Austin MA, et al.
Am J Cardiol.
1998;81:7B-12B.
†
Associated with an 89 mg/dL increase in triglyceride
*
P
<.05
HDL-C Level
Nonadjusted
Adjusted for
Relative CVD Risk
†
Triglyceride Level Is Independent CVD Risk Factor
Meta-Analysis of 17 Studies
*
*
*
*
Men (n = 46 413)
Women (n = 10 864)
Men (n = 22 293)
Women (n = 6345)Slide41
Triglyceride Level Is Significant CVD Risk Factor
Recent Meta-Analysis of 29 Studies
Sarwar N, et al.
Circulation. 2007;115:450-458.
*
Individuals in top versus bottom third
of usual log- triglyceride values, adjusted for at least age, sex, smoking status, lipid concentrations, and blood pressure (most)
CHD Risk Ratio* (95% CI)
1.72 (1.56-1.90)
2
1
Duration of follow-up
≥10 years 5902
<10 years 4256
Sex
Male 7728
Female 1994
Fasting status
Fasting 7484
Nonfasting 2674
Adjusted for HDL
Yes 4469
No 5689
N = 262 525
Groups CHD Cases
Top Tertile of TG defined as > 181 mg/dL
Lowest Tertile of TG defined as < 120 mg/dLSlide42
Physicians Health Study
Sacks F & Campos H.
The J
Clin
Endo &
Metab
88(10):4525–4532
Relative Risk
3.0
2.5
2.0
1.5
1.0
0.5
0.0
Low < 109
Medium 109-160
High > 160
Triglycerides mg/dL
LDL Size, nm
Large > 26.4
Medium > 26.4 -25.8
Small < 25.8
This figure demonstrates that the association between small LDL size and MI arises only from the association between small LDL size and high triglyceride concentration.
High triglyceride concentration is independently related to MI regardless of LDL size.Slide43
J
apan
E
icosapentaenoic Acid
L
ipid
I
ntervention
Study (
JELIS)
Saito Y et
al. Atherosclerosis 2008;
HR: 1.71 p=0.014
1.26
1.02
1.0
Adjusted risk coronary events
HDL-C
TG
Adjusted for age, gender, smoking, diabetes and HTN
TG and HDL-C values at time of registrationSlide44
E
nlarged
W
aist Combined With Elevated Triglyceride Is a Strong Predictor of Accelerated Atherogenesis and Related Cardiovascular Mortality in Postmenopausal Women
(EWET)
Conclusions: The combined presence of EWET may be the best indicator of cardiovascular risk in postmenopausal women.
The TG value of concern is 128 mg/dLOther components of the MS-NCEP add little medical value to screening in general practices.
Circulation.2005;111:1883-1890Slide45
Circulation
.2005;111:1883-1890
E
nlarged
W
aist Combined With
E
levated
Triglyceride (
EWET)
MS-NCEP +
EWET -
Cardiovascular
P<0.001
-2
0
2
4
6
8
10
0.7
0.8
0.9
1.0
1.1
Follow Up Time (years)
Cumulative Survival
Cumulative Survival
0.7
0.8
0.9
1.0
1.1
-2
0
2
4
6
8
10
P<0.001
MS-NCEP -
EWET +
Cardiovascular
Kaplan-Meier curves indicating cardiovascular event rates in women with (n=88) or without (n=469) EWET or with (n=100) or without (n=433) MS-NCEP
Follow Up Time (years)Slide46
Circulation
.2005;111:1883-1890
E
nlarged
W
aist Combined With
E
levated
Triglyceride (
EWET)
EWET –
MS-NCEP-
EWET +
MS-NCEP+
EWET +
MS-NCEP-
EWET –
MS-NCEP+
0.0
0.1
0.2
0.3
Overall p<0.001
Annual progression rate of Aortic Calcification during 8.5 year observation period in postmenopausal women with MS-NCEP, EWET, or both diagnostic criteria
Results shown are mean +/- SEM obtained after adjustment for age, smoking and LDL-C at baseline
Adjusted delta AC/years
#431
#31
#21
#67
Change in AC = Aortic calcification
* p<0.001 + p<0.001
a vs control b vs NCEP+
*a
+ab
+abSlide47
N = 105 men and 155 women
*EWET defined WC
≥90 cm and TG ≥180 mg/dL for men
and
WC ≥88 cm and TG ≥150 mg/dL for women
†sdLDL: small, dense LDL
EWET* (+)
EWET* (-)
P
-Value
LDL-C
(mg/dL)
148
144
NS
Apo B
(mg/dL)
112
99
P
<.001
sdLDL-C
†
(mg/dL)
22
5
P
<.001
sdLDL
†
(% of total LDL-C)
16
4
P
<.001
Mean LDL particle size
(nm)
26.1
26.9
P
<.001
Gazi IF, et al.
Lipids.
2006;41:647-654.
E
nlarged
W
aist Combined With
E
levated
T
riglyceride (
EWET
): LDL Particle DataSlide48
E
nlarged
W
aist Combined With Elevated Triglyceride (EWET
) Editorial
There is a growing consensus about the importance of triglycerides, particularly in women, and we have shown in the same national US sample that triglyceride level was the single most predictive component of the MS-NCEP for CVD in multivariate analysis.
Michael Criqui Editorial
Circulation.2005;111:1869-1870Slide49
ME
tabolic
,
Lifestyle, And
Nutrition Assessment in Young Adults Study (
MELANY)
Patients: 13 953 apparently healthy, untreated, young men (age 26 to 45 years) with triglyceride levels less than 300 mg/dL.
Measurements: Two triglyceride measurements (at enrollment
[time 1] and 5 years later
[time 2]), lifestyle variables, and incident cases of angiography-proven CHD.
Tirosh A et al. Ann Intern Med. 2007;147:377-385.Slide50
ME
tabolic
,
L
ifestyle, And
Nutrition Assessment in Young Adults Study (
MELANY)
Tirosh A et al. Ann Intern Med. 2007;147:377-385.
10
9
8
7
6
5
4
3
2
1
0
Low ≤ 81 mg/dL
Intermediate 82 - 130 mg/dL
High ≥ 131 mg/dL
Time-1 Triglyceride Levels, by Tertile
Time-2 Triglyceride Levels, by Tertile
Low (≤ 93 mg/dL)
Intermediate (94-147 mg/dL)
High (≥ 148 mg/dL)
Hazard Ratio
For 13 953 apparently healthy young adult men (mean age, 32 years; range, 26 to 45 years), 2 measurements of fasting serum triglycerides and lifestyle variables were obtained 5 years apart and followed for incident cases of angiography proven CHD.
The effect of baseline triglyceride levels (time 1) and changes (between time 1 and time 2) in triglyceride levels on CHD risk were estimated.Slide51
ME
tabolic
,
L
ifestyle,
A
nd
N
utrition Assessment in
Y
oung Adults Study (
MELANY
)
Tirosh A et al. Ann Intern Med. 2007;147:377-385.
Hazard ratios for CHD, by Quintile of Time-1 Triglyceride Level
Variable
Quintile 1
Quintile 2
Quintile 3
Quintile 4
Quintile 5
P value for trend
Range of TG Level mg/dL
30 - 66
67- 90
91 - 119
120 - 163
164 - 299
Follow-up, person-years
29,578
28,212
28,169
29,627
29,810
Incident cases of CHD
8
13
37
42
70
Acquired risk ratio (95% CI)
Age
Age and BMI
Age, BMI & HDL-C
Age, BMI, HDL-C & Family Hx CHD
Multivariate *
1.00 (reference)
1.00 (reference)
1.00 (reference)
1.00 (reference)
1.00 (reference)
1.12 (0.59-2.34)
1.43 (0.70-2.94)
1.26 (0.63-2.78)
1.13 (0.62-2.41)
1.04 (0.56-2.30)
3.70 (1.81-7.57)
4.48 (1.97-8.85)
4.17 (1.90-8.11)
3.78 (1.96-7.60)
2.93 (1.65-6.39)
3.84 (1.86-8.29)
5.10 (2.19-10.6)
4.03 (2.20-9.41)
3.96 (1.91-8.35)
3.18 (1.72-7.24)
5.15 (2.84-10.0)
7.06 (3.72-14.8)
6.22 (3.19-12.6)
5.29 (2.93-10.1)
4.05 (2.68-8.61)
<0.001
<0.001
<0.001
<0.001
<0.001
<0.001Slide52
ME
tabolic
,
Lifestyle, And
Nutrition Assessment in Young Adults Study (
MELANY)
The results suggest that information on triglyceride levels at 2 time points 5 years apart are
clinically relevant for assessing the risk for CHD.
Among young men with triglyceride levels lower than 300 mg/dL who were not receiving lipid-lowering therapy, changes in triglyceride levels were statistically significantly associated with alterations in BMI, physical activity, and the habit of eating breakfast.
These findings corroborate triglycerides as a sensitive marker of lifestyle changes.
However, a substantial proportion of the CHD risk remained attributable to changes in triglyceride levels during the subsequent 5.5 years of follow-up, independent of the associated alterations in BMI and lifestyle habits,
suggesting an independent cumulative effect.
Tirosh A et al. Ann Intern Med. 2007;147:377-385.Slide53
ME
tabolic
,
Lifestyle, And
Nutrition Assessment in Young Adults Study (
MELANY)
In the group where there was a decrease in triglyceride levels between time 1 and time 2
The high/low group was associated with reduced BMI and
A diminished proportion of smoking, and
An increase in physical activity and eating breakfast, all of which are related to adopting a healthier lifestyle. Thus
, triglycerides might be a valuable biomarker of lifestyle
(and/or weight) changes.Tirosh A et al. Ann Intern Med. 2007;147:377-385.Slide54
ME
tabolic
,
Lifestyle, And
Nutrition Assessment in Young Adults Study (
MELANY)
Conclusions: Two triglyceride measurements obtained 5 years apart may assist in assessing CHD risk in young men.
A decrease in initially elevated triglyceride levels is associated with a decrease in CHD risk
compared with stable high triglyceride levels. However, this risk remains higher than in those with persistently low triglyceride levels.
Tirosh A et al. Ann Intern Med. 2007;147:377-385.Slide55
ME
tabolic
,
Lifestyle, And
Nutrition Assessment in Young Adults Study (
MELANY)
Collectively, these findings highlight the predictive value of follow-up triglyceride measurements for CHD risk assessment in apparently healthy young men and may assist in estimating the potential value of lifestyle interventions for the primary prevention of CHD.
The difference in CHD risk between the high/high and the high/low groups
may suggest that decreasing triglyceride levels dramatically affects CHD risk within a relatively short period given the slow progression of CHD.
In this young age group, high triglyceride levels may identify those exhibiting accelerated atherosclerosis, resulting in clinically significant CHD by the mid-40s.
Tirosh A et al. Ann Intern Med. 2007;147:377-385.Slide56
Tirosh
A et al. Diabetes Care 2008;31:2032-2037
0
2
4
6
8
10
12
14
Low (≤81)
High (≥131)
Intermediate (82-130)
1
4.47
12.62
2.20
3.17
7.89
1.97
4.28
7.08
HR for Development T2DM
Time 1 Triglyceride Levels (mg/dL)
Time 2 TG
Tertiles
(mg/dL)
Low 2 (≤93)
Intermediate (94-147)
High 2 (≥148)
Association between TG and future morbidity
Multivariate model showing association of fasting TG obtained 5 years apart and incidence of T2DM
Adjusted for age, BMI, TC/HDL-C. FG, time lapse between time 1 & 2, BP, physical activity, FH of DM, & smoking
During 76,742 person-years, 322 cases of diabetes occurred.
ME
tabolic
,
L
ifestyle,
A
nd
N
utrition Assessment in
Y
oung Adults Study (
MELANY
)Slide57
Tirosh
A et al. Diabetes Care 2008;31:2032-2037
Diabetes
Heart Disease
Low Time 2
High Time 2
Low Time 2
High Time 2
Low Time 1
High Time 1
1
1.56 (0.33-7.4)
7.32
(2.62-20.7)
4.10
(1.93-8.73)
1
1.56 (0.33-7.4)
6.76
(1.34-33.92)
8.23
(2.50-27.13)
Multivariate model for comparing HRs for T2DM or CHD associated with fasting 2 TG measurements 5 years apart
Model adjusted for age FH of CHD, interval between time 1 & 2, HDL-C, glucose, BP, physical activity and BMI. Also adjusted for changes between time 1 & 2 for smoking and habit if eating breakfast
ME
tabolic
,
L
ifestyle,
A
nd
N
utrition Assessment in
Y
oung Adults Study (
MELANY
)Slide58
Tirosh
A et al. Diabetes Care 2008;31:2032-2037
Circulating triglyceride levels represent a balance between triglyceride synthesis and utilization. These are greatly affected by lifestyle factors (nutritional habits and exercise) and by insulin sensitivity.
Consistently, an increasing triglyceride level, particularly when accompanied by low HDL, was shown to be a surrogate marker of insulin resistance, a strong predisposing condition for type 2 diabetes.
Furthermore, high free fatty acids potentially derived from triglyceride may further deteriorate insulin sensitivity, creating a vicious cycle between triglyceride level and insulin resistance.
Such a process may have operated to acutely increase diabetes risk when triglyceride levels progressed during follow-up from the lowest to the highest tertile, potentially surpassing the excessive risk associated with persistently elevated triglyceride levels.
Improving insulin sensitivity and glucose tolerance by pharmacological means decreased circulating free fatty acids or triglyceride levels
ME
tabolic
,
L
ifestyle,
A
nd
N
utrition Assessment in
Y
oung Adults Study (
MELANY
)Slide59
Tirosh
A et al. Diabetes Care 2008;31:2032-2037
Two measurements of fasting triglyceride levels obtained 5 years apart can assist in identifying apparently healthy young men at increased risk for diabetes, independent of traditional risk factors and of associated changes in BMI and lifestyle parameters.
Conclusions
ME
tabolic
,
L
ifestyle,
A
nd
N
utrition Assessment in
Y
oung Adults Study (
MELANY
)Slide60
Statin Therapy Does Not Eliminate CV
Risk Associated With
High TG Level
HPS Collaborative Group. Lancet. 2002;360:7-22
Sacks FM et al. Circulation. 2000;102:1893-1900
Low TG + statin
High TG + statin
CVD Event Rate, %
HPS = Heart Protection Study:
High TG > 354 mg/dL
CARE = Cholesterol & recurrent Events
High TG > 207 mg/dl
LIPID = Long Term Intervention with Pravastatin in Ischemic Disease
High TG > 207 mg/dLSlide61
Pravastatin Pooling Project
Sacks F
Tomkins AM, et al.
Circulation 200;102:1893-1900
n = 13173
Pravastatin treatment is effective in reducing coronary heart disease events in patients with high or low risk factor status and across a wide range of pretreatment lipid concentrations,
but efficacy is less as TG rise
.
Coronary event rates according to Triglyceride concentrations. CARE and LIPID Trials combined
32
27
22
17
12
< 98
99-126
127-154
155-200
>200
< 98
99-126
127-154
155-200
>200
Triglyceride Quintile Ranges (mg/dL)
5
10
15
20
Event Rate (%)
Event Rate (%)
Baseline Triglycerides CAD Death, Nonfatal MI
Baseline Triglycerides CAD Death, Nonfatal MI, CABG/PTCA
13.1
12.0
11.6
10.8
Slope = 0.016 p=0.003
Interaction, p=0.26
10.7
14.5
15.3
14.2
15.4
15.7
Slope = 0.007 p=0.25
Slope = 0.018 p=0.02
Slope = 0.029 p=0.001
Placebo
Pravastatin
Placebo
Pravastatin
24.8
27.3
20.5
26.8
29.1
20.3
20.0
22.6
24.7
28.8
Interaction, p=0.06Slide62
Impact of Triglycerides Beyond LDL-C
PR
avastatin
O
r
Ator
V
astatin
E
valuation and
I
nfection
T
herapy (
PROVE IT):
Thrombolysis
In
Myocardial
Infarction
22 (
TIMI 22)
Miller M et al. J
Am Coll
Cardiol 2008;51:724–30
High triglycerides (
200 mg/dL) significantly increased the risk of death, MI or acute coronary syndrome at 30 days in patients who achieved LDL cholesterol levels <70 mg/dl on statin therapy. PROVE-IT trial.
25
20
15
10
5
0
≥200
(n=603)
<200
(n=796)
On-treatment TG level (mg/dL)
20.3
13.5
RR 0.64 (0.35-0.78) p = 0.001
30-day risk of death, MI or recurrent ACS (%)Slide63
Impact of Triglycerides Beyond LDL-C
PR
avastatin
O
r
Ator
V
astatin
E
valuation and
I
nfection
T
herapy (
PROVE IT):
Thrombolysis
In
Myocardial
Infarction
22 (
TIMI 22)
Miller M et al. J
Am Coll Cardiol
2008;51:724–30
Days after Month 1 Visit
0
150
LDL-C < 70
0.00
0.06
0.10
0.15
0.20
HR = 0.81
(0.68-0.96)
P = 0.015
330
510
700
0
150
330
510
700
LDL-C ≥ 70
0.00
0.06
0.10
0.15
0.20
TG < 150
TG ≥ 150
HR = 0.73
(0.62-0.87)
P <0.001
On-treatment TG 150
mg/dL
was independently associated with a lower risk of recurrent CHD events,
lending support
to the
concept that achieving low TG may be an additional consideration beyond low LDL-C
in
patients after
ACS
.
Event Rate (%)
Event Rate (%)
Estimates of death, myocardial infarction, and recurrent acute coronary
syndrome between
30 days and 2 years of follow-up
mg/dl
.Slide64
Impact of Triglycerides Beyond LDL-C
PR
avastatin
O
r
Ator
V
astatin
E
valuation and
I
nfection
T
herapy (
PROVE IT
):
T
hrombolysis
In
Myocardial
Infarction
22
(TIMI 22
)
Miller M et al. J Am Coll
Cardiol 2008;51:724–30
The referent (Ref) group is LDL-C ≥ 70
mg/dl
and TG ≥ 150 mg/dl. This model is adjusted for age, gender, low HDL-C,
smoking, hypertension, obesity, diabetes, prior statin therapy, prior ACS, peripheral
vascular disease, and treatment effect.
LDL-C < 70
LDL-C ≥ 70
TG < 150
TG ≥ 150
HR = 0.85 (0.67-1.08)
P = 0.017
P = 0.180
P = 0.192
15%
17.9%
HR = 0.72 (0.54-0.94)
16.5%
11.7%
20
15
10
5
0
Rate of death, MI or recurrent ACS after 30 days
REFSlide65
Am Heart J 2004;148:211–21
High TG, low HDL-C and normal levels of LDL-C can be described as
abnormalities of the TG-HDL axis
.
This lipid abnormality is a fundamental
characteristic of patients with the metabolic syndrome
, a condition strongly associated with the development of both type 2 diabetes and CHD.
Patients with high TG and low HDL-C should be aggressively treated with therapeutic lifestyle changes.
For high-risk patients, lipid-modifying therapy that specifically addresses the
TG-HDL axis should also be considered. Current pharmacologic treatment options for such patients include statins, fibrates, niacin, fish oils, and combinations
thereof. Slide66
Framingham Offspring Study
TG/HDL-C vs. TC/HDL-C in Predicting Insulin Resistance
Kannel
WB et al. Am J
Cardiol
2008;101:497–501
The findings are threefold.
First, cross-sectional analyses suggested that of the several candidate lipid markers evaluated,
TG/HDL cholesterol ratio
was the best correlate of IR.
Second, longitudinal analyses showed that even after adjustment for lipid variables (including TG/HDL cholesterol ratio),
IR was significantly and strongly associated with CHD risk.
Third,
total/HDL cholesterol ratio was almost as powerful a predictor of insulin resistant CHD risk as TG/HDL cholesterol ratio.
These prospective analyses suggested that lipid variables (including TG/HDL cholesterol ratio) were imperfect surrogates of IR.
0.9
1
0.8
0.7
0.6
0.5
0.4
0.3
0.2
0.1
0
0
0.2
0.4
0.6
0.8
1
1-Specificity
Sensitivity
Total Cholesterol
HDL-C
TC/HDL-C ratio
Triglycerides
TG/HDL-C ratioSlide67
Oral Triglyceride Tolerance Test
Time After Oral Fat Load (hours)
Nondiabetics
Diabetics
80
40
Triglycerides (mg/dL)
0
2
4
6
8
320
280
240
200
120
160
Mohanlal N & Holman R. Diabet Care 2004;27:89-94
80
40
0
2
4
6
8
320
280
240
200
120
160Slide68
80
160
240
320
PP Time Points of Measurements
Heine, RJ & Dekker JM. Diabetologia 1997;40:454-462
Daytime Triglyceride Profile of Type 2 Diabetics with Normal Fasting Levels
Triglycerides mg/dL
2
3
4
5
6
7
Median
25
th
%tile
75
th
%tile
1
BF
L
D
BT
200
NCEP High Risk
NCEP Moderate RiskSlide69
Postprandial Change in Lipids and Flow Mediated Dilation after Oral Fat Load
Franco M et al. J Clin Endo & Metab 2004;89:2946-2950
0h
2h
4h
6h
8h
0h
2h
4h
6h
8h
0h
2h
4h
6h
8h
2
3
4
5
6
7
10
12
14
16
18
0.4
0.7
0.8
0.9
1.0
0.6
0.5
mmol/L
% Dilation
mmol/L
FMD
Remnant-C
Triglycerides
15 moderately overweight & dyslipidemic men with baseline TG of 210 and HDL-C of 39 given an oral fat load
TG & RLP-C increased significantly and continuously up to 4 & 6 hours respectively
FMD revealed decreased vasodilation at 4-6 hours
RLP contribute significantly to impair endothelial dilationSlide70
Postprandial Triglyceride Levels in Subjects With and Without Coronary Artery Disease
Patsch JR et al.
Arterioscler Thromb
. 1992;12:1336-1345.
Plasma triglycerides (mg/dL)
Hours after meal
*
P
=0.025;
†
P0.001.
*
†
†
CAD (n=61)
0
100
200
300
400
0
2
4
6
8
No CAD (n=40)Slide71
Postprandial Lipids in Controls and Type 2 Diabetes with Optimal Glucose Control
Time After Oral Fat Load (hours)
Before Lipid Lowering Treatment
Fasting & PP TG (mg/dL)
177
89
0
4
8
12
24
20
16
DiabeticPatients
Controls
709
620
531
445
265
354
Fasting & PP RP (mg/dL)
0
4
8
12
24
20
16
500
400
300
100
200
50
Cavallero et al. Atherosclerosis 2003;166:151-161Slide72
Fenofibrate and Postprandial Lipids in Type 2 Diabetes with Optimal Glucose Control
Time After Oral Fat Load (hours)
Before Treatment
After Treatment
Fasting & PP TG (mg/dL)
Fasting & PP RP (mg/dL)
177
89
0
4
8
12
24
20
16
DiabeticPatients
Controls
Placebo
Fenofibrate
709
620
531
445
265
354
709
620
531
445
265
354
177
89
0
4
8
12
24
20
16
0
4
8
12
24
20
16
0
4
8
12
24
20
16
500
400
300
100
200
50
500
400
300
100
200
50
Cavallero et al. Atherosclerosis 2003;166:151-161Slide73
Fenofibrate and Postprandial Lipids in Type 2 Diabetes with Optimal Glucose Control
Time After Oral Fat Load (hours)
After Treatment
Placebo
3 Month pretreatment with Fenofibrate
709
620
531
445
265
354
177
89
0
4
8
12
24
20
16
0
4
8
12
24
20
16
500
400
300
100
200
50
Cavallero et al. Atherosclerosis 2003;166:151-161
Fasting & Postprandial Triglycerides (mg/dL)
Fasting & Postprandial Remnants (mg/dL)Slide74
HDL-C and Postprandial Lipemia
Kolovou GD et al. Lipids in Health & Disease 2004;3:18
350
250
150
50
0
Low HDL
Low TG Low HDL
Low TG Controls
Low HDL-A
Low HDL-N
Controls
0
4
6
8
Time (h)
Triglyceride mg/dL
HDL-A = abnormal PP response HDL-N = normal PP response
TG (AUC) in Relation to Time
Low fasting TG defined as < 100Slide75
HDL-C and Postprandial Lipemia
The
delayed TG clearance
postprandially seems to
result in low HDL-C levels
even in subjects with low fasting TG
Fasting TG levels appear to be the
primary determinant of the magnitude of postprandial lipemia.
TG Levels > 121 mg/dL
are predictable for abnormal response to a fatty mealThe increase in TG 2-4 hours PP reflects dietary TG absorption
The return to fasting levels (6-9 hours) is a function of TG clearance
Suspected factors affecting PP hypertriglyceridemiaApoCIII, Apo E, ApoAI, ApoAIV,
Cholesteryl ester transfer protein CETP
Kolovou GD et al. Lipids in Health & Disease 2004;3:18
PolygenicSlide76
HDL-C and Postprandial Lipemia
TG levels 4 hours after the fatty meal
The low HDL subjects had a significantly higher (p<0.006) TG level compared to controls
TG levels 6 hours after the fatty meal
The low HDL subjects had a significantly higher (p<0.002) TG level compared to controls
TG levels 8 hours after the fatty meal
The low HDL subjects had a significantly higher (p<0.001) TG level compared to the controls
Glucose did not show any change postprandially
Kolovou GD et al. Lipids in Health & Disease 2004;3:18Slide77
1) Elevated TG are often associated with atherogenic
chylomicron remnants
2) Increased hepatic TG result in excess concentration of VLDL particles,
VLDL remnants
Triglycerides and Atherogenesis
3) Increased hepatic TG result in excess concentration of
LDL particles
4) Increased hepatic TG concentrations result in overproduction of TG rich VLDL particles which become
small, dense LDL particles
5) Elevated hepatic TG concentrations result reduction of HDL particles overburdened with reverse cholesterol transport:
HDL-C dropsSlide78
1) Increased triglycerides are often associated with atherogenic
chylomicron and VLDL remnants
Triglycerides and Atherogenesis
2) Increased triglycerides result in increased concentration of
LDL particles
3) Increased triglycerides result in promotion of
small, dense LDL particles
4) Increased triglycerides result in formation of small, cholesterol depleted HDL particles and
decreased
HDL-C.
ApoB
↑
ApoA
↓Slide79
Framingham Offspring Study
LDL-P (particle #) and TG
As
TG
levels rise so does LDL particle concentration
1800
1600
1400
1200
1000
LDL Particles (nmol/dL)
0 50 100 150 200 250 300 350 400
Triglycerides
LDL Particles
Otvos JD, Cromwell, WC. DALM Scientific Sessions, New York, NY, Sept. 2001
(n = 3,437)
Bottom 20
th
percentile
Borderline High Risk
High Risk
Goal for High Risk PatientSlide80
As TG rises so does LDL particle concentration
Above TG of 150 to 175 mg/dl LDL-C starts to fall
1800
1600
1400
1200
1000
0 50 100 150 200 250 300 350 400
LDL Particles
LDL -C
180
160
140
120
100
LDL Cholesterol (mg/dL)
Otvos JD, Cromwell, WC. DALM Scientific Sessions, New York, NY, Sept. 2001
TG, LDL particle # and LDL-C
LDL Particles (nmol/dL)
Triglycerides
(n = 3,437)
Framingham Offspring Study
High Risk
Borderline High RiskSlide81
Relationship of Triglycerides
and LDL Particle Size
Cumulative % Frequency
Austin M, et al.
Circulation.
1990;82:495-506.
0
10
20
30
40
50
60
70
80
90
100
0
40
80
120
160
200
240
280
Triglyceride mg/dL
Small, Dense LDL (pattern B)
Large, Buoyant LDL (pattern A)Slide82
Framingham Offspring Study LDL-P and Metabolic Syndrome
1000
1200
1400
1600
1800
2000
LDL-P (nmol/L)
LDL-C (mg/dL)
0
100
200
300
400
100
120
140
160
Triglycerides (mg/dL)
Kathiresan S, Otvos JD, Sullivan LM et al.
Circulation
. 2006;113:20-29.
High Risk
Borderline-High Risk
n=2993
Mean adjusted total LDL-P and LDL-CSlide83
Relationship of Small LDL to Triglyceride in African Americans
Benton J. et al. Am J Cardiol 2005;95:1320–1323
250
200
150
130
100
75
50
0.0
0.1
0.2
0.3
0.4
0.5
0.6
0.7
0.8
0.9
1.0
0.0
0.2
0.4
0.6
0.8
1.0
Sensitivity (true positive)
1 – Specificity (false positive)
A triglyceride level of 130 to 150 mg/dl identified subjects who had pattern B with good sensitivity and excellent specificity.
In subjects whose triglyceride level was
≥
150 mg/dl, 67% had pattern B, whereas only 17% of subjects whose triglyceride level was
<
150 mg/dl had pattern B. Therefore, the positive predictive value of triglyceride levels
>
150 mg/dl for predicting pattern B is 67% and the negative predictive value is 83%.
NMR LipoProfile
Fasting triglyceride measurement, appears to be a useful surrogate for direct measurement of particle sizeSlide84
1) Increased triglycerides are often associated with atherogenic
chylomicron and VLDL remnants
Triglycerides and Atherogenesis
2) Increased triglycerides result in increased concentration of
LDL particles
3) Increased triglycerides result in promotion of
small, dense LDL particles
4) Increased triglycerides result in formation of small, cholesterol depleted HDL particles and
decreased
HDL-C. Reverse cholesterol transport is impaired
ApoB
↑
ApoA
↓Slide85
Relationship of Small LDL to Triglycerides
Hanak, V. et al. Am J Cardiol 2004;94:219–222
< 150
150-199
≥
200
Triglycerides mg/dL
19
20
21
22
19.5
20.5
21.5
LDL Particle Size (nm)
Females
Males
*
*
*
Mean LDL particle size was significantly smaller (*p <0.05) in men compared with women for any given TG category
NMR SpectroscopySlide86
Relationship of Small LDL to HDL-C
Hanak, V. et al. Am J Cardiol 2004;94:219–222
< 40
40-59
≥
60
HDL-C mg/dL
19
20
21
22
19.5
20.5
21.5
Females
Males
LDL Particle Size (nm)
Mean LDL particle size was smaller (p = NS) in men compared with women for any given HDL-C category
NMR SpectroscopySlide87
Relationship of LDL Particle Size to Triglyceride Categories
Hanak, V. et al. Am J Cardiol 2004;94:219–222
< 150
≥ 200
150 - 190
Triglycerides (mg/dL)
19
19.5
20
20.5
21
21.5
22
*
*
*
Females
Males
LDL Particle Size (nm)
Mean LDL Particle Size in Men and Women plotted by TG Categories (based on NCEP ATP-III
Mean LDL Particle Size was significantly smaller (*p <0.05) in men compared for women for any given TG categorySlide88
Relationship of LDL Particle Size to HDL-C Categories
Hanak, V. et al. Am J Cardiol 2004;94:219–222
< 40
≥ 60
140 - 159
HDL-C (mg/dL)
19
20
21
22
Females
Males
LDL Particle Size (nm)
19.5
20.5
21.5
Mean LDL Particle Size in Men and Women plotted by HDL-C Categories (based on NCEP ATP-III
Mean LDL Particle Size was similar in men (p=NS)Slide89
Relationship of Small LDL to Triglyceride/HDL-C Ratio
Hanak, V. et al. Am J Cardiol 2004;94:219–222
Triglyceride/HDL-C mg/dL Ratio
0
2
4
6
8
10
12
0
20
40
60
80
100
Females
Large LDL
Small LDL
Cumulative Frequency (%)
NMR Spectroscopy
At a ratio ≥ 3.8, 80% of patients will have small LDL phenotypeSlide90
Relationship of Small LDL to Triglyceride/HDL-C Ratio
Hanak, V. et al. Am J Cardiol 2004;94:219–222
NMR Spectroscopy
In men, 76% of the LDL phenotype A was less than and 77% of phenotype B was greater than the cutoff of 3.8.
0
2
4
6
8
10
12
0
20
40
60
80
100
Large LDL
Small LDL
Cumulative Frequency (%)
Triglyceride/HDL-C mg/dL Ratio
MalesSlide91
Triglycerides, ApoAI and HDL-C
Patients with elevated triglycerides have increased amounts of TG-rich apoB particles (VLDL and IDL and LDL):
ApoB levels are
↑
CETP exchanges TG for cholesterol
between
the apoB (VLDL) and apoA (HDL) particlesTG-rich HDL particles then become substrates for hepatic lipase in hepatic sinusoids
The lipolysis results in a
reduction of large and increase in small HDL particlesThe small HDL (apoA-I) is subject to renal excretion Slide92
Triglycerides, ApoAI and HDL-C
Thus, Hypertriglyceridemia will often be associated with decreased HDL-C and ApoA levels and elevated apoB levels or
↑ ApoB/ApoA ratios
↑
ApoB
is a measure of atherogenic particles
The
reduced apoA
is will result in
Impaired reverse cholesterol transportDecreased numbers of HDL particles performing other antiatherogenic activities