/
%  behaviour incidents %  behaviour incidents

% behaviour incidents - PowerPoint Presentation

calandra-battersby
calandra-battersby . @calandra-battersby
Follow
408 views
Uploaded On 2017-03-22

% behaviour incidents - PPT Presentation

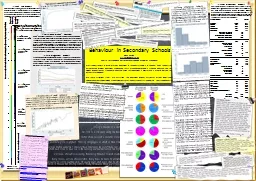
cumulative pupils Concentration of behaviour incidents Percentage of pupils accounting for percentage of incidents 015 of pupils explain 1 of incidents 039 of pupils explain 5 of incidents ID: 527915

behaviour incidents pupil pupils incidents behaviour pupils pupil schools day explain poor lesson time rate incident rates behaved badly school years responsible

Share:

Link:

Embed:

Download Presentation from below link

Download Presentation The PPT/PDF document "% behaviour incidents" is the property of its rightful owner. Permission is granted to download and print the materials on this web site for personal, non-commercial use only, and to display it on your personal computer provided you do not modify the materials and that you retain all copyright notices contained in the materials. By downloading content from our website, you accept the terms of this agreement.


Presentation Transcript

Slide1

%

behaviour incidents

cumulative

% pupils

Concentration of behaviour incidents: Percentage of pupils accounting for percentage of incidents

0.15% of pupils explain 1% of incidents

0.39% of pupils explain 5% of incidents

0.91% of pupils explain 10% of incidents

2.89% of pupils explain 25% of incidents

7.86% of pupils account for 50% of incidents

17.57% of pupils explain 75% of incidents

31.51% of pupils explain 90% of incidents

41.23% of pupils explain 95% of incidents

58.1% of pupils explain 99% of incidents

32.79% of pupils have no incidents at all

N pupils = 3284

N incidents = 44,668

67.21% of pupils account for all incidents

(2) Persistence of pupils’ behaviour

Pupils’

b

ehaviour is highly persistent, both good and bad. Pupils who started in the 10

th

(worst) decile for behaviour incidents by year group and school still had significantly higher average rates of incidents per day four terms later than pupils who started off in lower deciles. Pupils who started in the 1

st

decile, with the lowest rate of incidents, still had significantly lower incident rates four terms later. Nevertheless, the graph shows a certain amount of mean reversion, particularly for the 10

th

decile, with the incident rates of all groups converging. However, the initial ordering is maintained over two years.

(3) Rate of behaviour incidents

Even the most badly-behaved 10% of pupils start with an average incident rate of less than 0.25 incidents per day, or just under one incident every four school days. The mean for all pupils is 0.036 incidents per pupil per day, or about 6.8 incidents in an academic year: almost all pupils behave well most of the time.

Cumulative frequency of incidents

by pupil

A small minority of pupils are responsible for the majority of incidents.

Behaviour in Secondary Schools

Amy Challen

a.r.challen@lse.ac.uk

Centre for Economic Performance, London School of Economics

Press reports

paint a bleak picture of behaviour in secondary schools in England. They suggest that disruptive and insolent behaviour is common; that a large number of pupils are badly behaved; and that violent incidents occur frequently. They also claim that behaviour is worse than it used to be, and that parents are to blame.Are these assertions true? I use data from the behaviour incident databases of four typical English comprehensive schools to look at behaviour patterns. The data covers 3,284 pupils in four schools over 2-6 academic years.

(6) Timing of behaviour incidents

The rate of behaviour incidents varies by time of day and day of the week. Mondays have the most incidents, followed by Tuesdays, with few incidents on Wednesday-Friday. These schools have five lessons per day. Behaviour is best in Lesson 1, getting worse through the day, with the most incidents in Lesson 5. These patterns are seen in all groups of pupils, whether they have high or low rates of incidents.

Figure shows rate of incidents per pupil

per day

with

95% confidence

intervals

.

Figure shows

rate

of incidents per pupil per

lesson with 95% confidence intervals.

(7) Types of behaviour incidents

The types of incident recorded in the databases are listed below, for 3,284 pupils over an average of 2.4 academic years per pupil. 69% of incidents involve disruption, defiance, lateness or lack of equipment: relatively minor offences. 13.3% involve verbal or physical abuse or aggression, or other severe incidents. This suggests that the majority of poor behaviour in schools is disruptive, but not violent.

(8) Conclusions

Many media reports probably exaggerate the severity of behaviour in schools, focusing on violent incidents which are in fact relatively rare. However, low-level disruption is common. It is also not true that most pupils are regularly unruly: most pupils are well behaved most of the time, and one third are never involved in incidents. These findings are in line with reports by the Department for Education and Ofsted (

DfE

,

2012; Ofsted, 2005).Nevertheless, there is a high degree of concentration in incidents, with 10% of pupils accounting for more than half of all incidents: these pupils clearly have problematic behaviour. Pupils’ behaviour is persistent through time, and pupils who frequently misbehave do so with many different teachers, suggesting that behaviour problems are not context specific. Demographic characteristics are good predictors for behaviour, but do not tell the full story: they do not explain that much of the variation in behaviour, and there is substantial heterogeneity in behaviour within demographic groups. Segal (2008) obtains very similar results with a detailed dataset from American high schools. Thus although we cannot say whether parents are ‘to blame’ for their children’s behaviour, a pupil’s demographic background is a strong predictor of the likelihood that they will behave well or badly. Interestingly, rates of misbehaviour vary through the day and week – schools could take this into account when scheduling to minimise disruption in key lessons. My data panel only lasts up to 6 years, so I cannot say whether poor behaviour has become more frequent or more severe over the past few decades. However, it would appear that bad pupil behaviour is at least nothing new…

(1) Pupils and incidents

Poor behaviour is highly concentrated among a small number of pupils. 7.86% of pupils are responsible for half of all behaviour incidents, while one third of pupils have no behaviour incidents at all. The remainder are somewhere in the middle, with occasional misbehaviour.

Descriptions of behaviour from the database

(names have been changed)

Gluing

a teacher to a chair.

Set fire to a flip chart during the lesson

Verbal abuse towards a member of

staff

.

Covered 4 girls in yoghurt Throwing things again at people at break time.In science Sophie asked me if she could leave the class so she could "Have a fag", as she didn't have time to have one in the morning and had her last one last night.Defiance, disruption, swearing, threatening behaviour towards student..Every lesson, Callum draws soldiers. Every lesson, he has to be prompted continually to write anything down. He usually says 'I don't know what I'm doing' - which is because he's drawing soldiers. Today, 10 minutes before end of lesson, nothing written.

Incidents

per pupil and

number

of teachers involved

(4) Consistency of pupils’ behaviour

Is poor behaviour usually the result of a bad pupil-teacher combination, or do pupils with many behaviour incidents behave badly with many different teachers? It appears that pupils with more incidents also misbehaved with more teachers, with a ratio of about one new teacher to every two more incidents. This suggests that poor behaviour is not context specific.

(5) Pupil characteristics

10% of pupils are responsible for over half of all behaviour incidents. What are the characteristics of these pupils?

Here I compare the 10% of pupils responsible for most incidents, with the other 90% of their peers at these schools. Pupils with poor behaviour are significantly more likely to be boys; to have special educational needs; to be eligible for free school meals; to be from a white ethnic background; to live with only one or neither of their parents; and to have failed to achieve the national standards in English and maths in national tests at age 11 (level 4 at Key Stage 2).

However, there is still heterogeneity, and no variable is a perfect predictor of behaviour – for instance, although boys are more likely to have poor behaviour, 29.3% of the worst behaved pupils are girls. Overall, demographic characteristics are strongly associated with the likelihood of a pupil having very poor behaviour, but the relationship is not deterministic and there are many pupils who buck the trend.

Daily Mail, 25

th

July 2012

Refs/acknowledgements

Content based on “Behaviour and scheduling in English secondary schools”, Amy Challen, unpublished manuscript January

2013

Additional data from the National Pupil Database

DfE

. (

2012).

Pupil behaviour in schools in England

DfE

Research Reports

. London: Department for Education.

Ofsted. (2005). Managing challenging behaviour HMI

2363

Segal, C. (2008). Classroom

Behavior

.

Journal of Human Resources, 43

(4), 783–814

.

Historic newspaper

citations from the British Newspaper Archive:

http://www.britishnewspaperarchive.co.uk/ Blackboard image:http://www.officialpsds.com/images/embedPSD/10951.jpgStationery clip art:http://www.hscripts.com/freeimages/icons/stationary/index.php