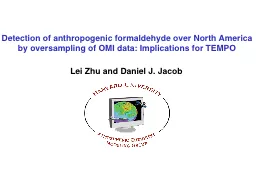
by oversampling of OMI data Implications for TEMPO Lei Zhu and Daniel J Jacob HCHO observations from space constrain emissions of highly reactive volatile organic compounds HRVOCs HRVOCs HCHO ID: 358035
Download Presentation The PPT/PDF document "Detection of anthropogenic formaldehyde ..." is the property of its rightful owner. Permission is granted to download and print the materials on this web site for personal, non-commercial use only, and to display it on your personal computer provided you do not modify the materials and that you retain all copyright notices contained in the materials. By downloading content from our website, you accept the terms of this agreement.
Slide1
Detection of anthropogenic formaldehyde over North Americaby oversampling of OMI data: Implications for TEMPO
Lei Zhu and Daniel J. JacobSlide2
HCHO observations from space constrain emissionsof highly reactive volatile organic compounds (HRVOCs)
HRVOCs
HCHO
h
,
OH
oxidation
~ 2 hours
and funding from NASA
ACMAP
OMI HCHO columns
Jan 2006
Jul 2006
T.P.
Kurosu
a
nthropogenic biogenic pyrogenic
< 1 daySlide3
Nigerian air pollution revealed by satellite
OMI formaldehyde
2005-2009
MISR
SCIA
a
erosol (AOD) NO
2
HCHO
glyoxal
methane
Population: 170 million (+3% a
-1
)
GDP: $270 billion (+7% a-1) – oil!Most natural gas is flared
>80% of domestic energy from biofuel, waste
LagosPortHarcourt
An unusual mix of very high VOCs, low
NOx –What will happen as infrastructure develops?Marais et al., 2014
gas
flaring!
10
15
molecules cm
-2
TES
825
hPa
ozoneDJFSlide4
Detection of anthropogenic HRVOCs from HCHO over US has been elusive:
elevated HCHO is mainly from isoprene
Millet et al. [2008]
OMI satellite observations of formaldehyde (HCHO) columns, Jun-Aug 2006
HCHO
h
,
OH
2 hours
oxidation
isoprene
1 hourSlide5
Using non-growing season to avoid isoprene interference doesn’t work – HCHO observations are then below detection limit
Detection limit
(for 1-month average)
HCHO detection in winter hampered by
l
ow sun angles
l
ow PBL heights
slow chemistry
GOME data [Abbot et al., 2003]Slide6
Problem is that US urban/industrial plumes are small and localized
OMI monthly detection limit of 5x10
15
molecules cm
-2
≡ 1 ppb HCHO in 2 km PBL
HCHO ~ 10 ppb observed in cores of urban/industrial plumes but not on scale of OMI pixels (13x24 km
2 nadir)
Day 1
Day 2
Day 3
Solve problem by oversampling: achieve spatial resolution finer than pixel size
b
y temporal averaging
Apply to OMI HCHO May-Aug 2005-2008 retrieval on 2x2 km
2
grid, 24 km smoothing Slide7
Oversampled OMI HCHO over eastern Texas (May-Aug 2005-2008)
Isoprene in green
Large AHRVOC point sources in black
vegetation
p
revailing
windSlide8
Lack of temperature dependence of HCHO in Houston urban coresupports anthropogenic attribution
exp
[0.11
T
]Slide9
Using OMI HCHO to quantify Houston AHRVOC emissions
HCHO source
= HCHO column
o
= background column
= 260 ± 110
kmol
h
-1
Consistent with
S =
240 ± 90
kmol
h
-1
from TEXAQS[Parrish et al., 2012]
Species
Emissionkmol h-1HCHO sourcekmol h
-1
ethene1627propene
6.312HCHO
9.49.4CH3
CHO1.2
1.2TOTAL33
49
Compare to EPA AHRVOC inventory (NEI 05)
EPA inventory isfactor of 5.5 ± 2.4 too low
Integrate HCHO enhancement over area of Houston plume
Background
oSlide10
Implications for TEMPO
TEMPO should perform much better than OMI in detecting AHRVOC emissions
Detecting AHRVOC emissions from oil/gas fields is of particular interest; OMI is marginal, TEMPO has promise.
Staggering TEMPO pixels from day to day would allow oversampling but that does not seem necessary
Observed diurnal variation of urban/industrial plumes will constrain primary vs.
secondary HCHO sources
Instrument
Pixel resolution
HCHO detection limit
(single retrieval)OMI13x24 km2
2x10¹⁶ molecules cm-2TEMPO2x4.5 km
21x1016 molecules cm-2