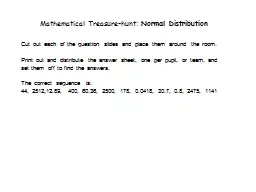
Normal Distribution Cut out each of the question slides and place them around the room Print out and distribute the answer sheet one per pupil or team and set them off to find the answers The correct sequence is ID: 345110
Download Presentation The PPT/PDF document "Mathematical Treasure-hunt:" is the property of its rightful owner. Permission is granted to download and print the materials on this web site for personal, non-commercial use only, and to display it on your personal computer provided you do not modify the materials and that you retain all copyright notices contained in the materials. By downloading content from our website, you accept the terms of this agreement.
Slide1
Mathematical Treasure-hunt: Normal Distribution
Cut out each of the question slides and place them around the
room.
Print out and distribute the answer sheet, one per pupil, or team, and set them off to find the answers.
The correct sequence is
:
44, 2512,12.89, 400, 60.36, 2500, 178, 0.0418, 30.7, 0.8, 2475, 1141
Slide2
Mathematical Treasure-hunt:
2512
Previous Answer
?
To the next clue
Mathematical Treasure-hunt:
44
Previous Answer
?
To the next clue
The
length of a component may be modelled by a Normal distribution with standard deviation 3 cm. 15% of the components are longer than 16 cm. Calculate the mean
length.
The lifetime of an electrical component may be modelled by a Normal distribution with mean 2500 hours and variance 900 hour
2
. How long would you expect
35
% of the components to last? Slide3
Mathematical Treasure-hunt:
400
Previous Answer
?
To the next clue
Mathematical Treasure-hunt:
12.89
Previous Answer
?
To the next clue
The weight of the contents of a jar may be modelled by a Normal distribution. 18% weigh more than 428g and 30% weigh more than 416g. Find the
mean.
Assume that the lifetime of a certain type of light bulb may be modelled by a Normal distribution. It is found that 7% of the bulbs last for more than 1230 hours and 12% for less than 1070 hours. What
is
the
standard
deviation of the lifetime of these bulbs? Slide4
Mathematical Treasure-hunt:
Sequences
2500
Previous Answer
?
To the next clue
Mathematical Treasure-hunt:
Sequences
60.36
Previous Answer
?
To the next clue
The lifetime of an electrical component may be modelled by a Normal distribution with mean 2500 hours and variance 900 hour
2
. How long would you expect
50
% of the components to last?
The quartiles of a Normal distribution are known to be 35 and 53. Find the
variance
of the distribution. Slide5
Mathematical Treasure-hunt:
Sequences
0.0418
Previous Answer
?
To the next clue
Mathematical Treasure-hunt:
Sequences
178
Previous Answer
?
To the next clue
The weight of the contents of a jar may be modelled by a Normal distribution. 18% weigh more than 428g and 30% weigh more than 416g. Find the
standard
deviation of the weight.
Packets
of currants are nominally 500g in weight. The actual weights may be modelled by a Normal distribution with mean 508.3g and standard deviation 4.8g. What is the probability that a packet is underweight? Slide6
Mathematical Treasure-hunt:
Sequences
0.8
Previous Answer
?
To the next clue
Mathematical Treasure-hunt:
Sequences
30.7
Previous Answer
?
To the next clue
The lifetime of an electrical component may be modelled by a Normal distribution with mean 2500 hours and variance 900 hour
2
. How long would you expect
80
% of the components to last?
A factory produces a very large number of rods. The lengths of these rods may be modelled by a Normal distribution, with 30% of them measuring 30.6 cm or more and 15% of them measuring 29.2 cm or less.
Estimate
the proportion of rods which measure 29.9 cm or more. Slide7
Mathematical Treasure-hunt:
1141
Previous Answer
?
To the next clue
Mathematical Treasure-hunt:
2475
Previous
Answer
?
To the next clue
Assume that the lifetime of a certain type of light bulb may be modelled by a Normal distribution. It is found that 7% of the bulbs last for more than 1230 hours and 12% for less than 1070 hours. What
is
the mean
of
the lifetime of these bulbs?
The quartiles of a Normal distribution are known to be 35 and 53. Find the mean
of
the distribution. Slide8
This powerpoint template was kindly donated to
www.worldofteaching.com
http://www.worldofteaching.com
is home to over a thousand
powerpoints
submitted by teachers. This is a completely free site and requires no registration. Please visit and I hope it will help in your teaching.