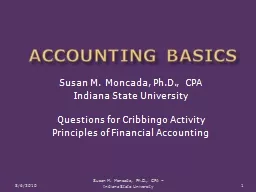
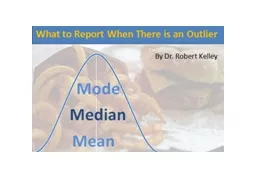
21 1 1 0 3 1 2 2 Which measure of central tendency will best convey how often the students typically eat out Possible Answers Mean Median or Mode The Scenario Mean The arithmetic average Add up all of the values and divide by the number of scores ID: 137206
Download Presentation The PPT/PDF document "Susan interviewed the twenty five studen..." is the property of its rightful owner. Permission is granted to download and print the materials on this web site for personal, non-commercial use only, and to display it on your personal computer provided you do not modify the materials and that you retain all copyright notices contained in the materials. By downloading content from our website, you accept the terms of this agreement.
Slide1Slide2Slide3
Susan interviewed the twenty five students in her class, asking each person how often they eat out. Most students replied between zero and three times. However, one student reported eating out for every single meal (21 meals a week). Data: 2, 0, 1, 0, 2, 2, 1, 0, 0, 2, 1, 3, 3, 3, 2, 1, 3,
21
, 1, 1, 0, 3, 1, 2, 2Which measure of central tendency will best convey how often the students typically eat out?Possible Answers: Mean, Median, or Mode
The ScenarioSlide4
Mean
: The arithmetic average. Add up all of the values and divide by the number of scores.
Mean = 2, 0, 1, 0, 2, 2, 1, 0, 0, 2, 1, 3, 3, 3, 2, 1, 3, 21, 1, 1, 0, 3, 1, 2, 2 25
= 57 meals ‘eaten out’ 25 students = 2.28 meals ‘eaten out’ per student
MeanSlide5
Consider what the mean would be
without the outlier
…Mean = 2, 0, 1, 0, 2, 2, 1, 0, 0, 2, 1, 3, 3, 3, 2, 1, 3, 1, 1, 0, 3, 1, 2, 2 24
=
36 meals eat out 24 students = 1.5 meals ‘eat out’ per studentMeanSlide6
College Student Income
US Dollars
(in thousands)MeanSlide7
US Dollars
(in thousands)
MeanCollege Student IncomeSlide8
US Dollars
(in millions)
MeanCollege Student IncomeSlide9
US Dollars
(in millions)
Based on the Mean… College Students are Millionaires!Mean
MeanSlide10
Mean
– Uses all data, but is
sensitive to outliersMeanSlide11
Mode
: The most frequently occurring value
ModeSlide12
Mode
: The most frequently occurring value
Modes: 1, 2
ModeSlide13
Mode
: The most frequently occurring value
Mode: 0
Mode
A small change in frequency can affect the mode(s)Slide14
Mode
: The most frequently occurring value
Mode: 0
Mode
A small change in frequency can affect the mode(s)
Students Don’t Typically Eat OutSlide15
Mode
– Perhaps the least robust. Easily affected by small changes in frequency
ModeSlide16
Median
: The middle value in a ranked distribution. If there are an even number of values, then take the average of the middle two values.
MedianSlide17
Median
: The middle value in a ranked distribution. If there is an even number of values, then take the average of the middle two values.
Raw Data: 2, 0, 1, 0, 2, 2, 1, 0, 0, 2, 1, 3, 3, 3, 2, 1, 3, 21, 1, 1, 0, 3, 1, 2, 2
MedianSlide18
Median
: The middle value in a ranked distribution. If there is an even number of values, then take the average of the middle two values.
Raw Data: 2, 0, 1, 0, 2, 2, 1, 0, 0, 2, 1, 3, 3, 3, 2, 1, 3, 21, 1, 1, 0, 3, 1, 2, 2
Ranked
: 0, 0, 0, 0, 0, 1, 1, 1, 1, 1, 1, 1, 2, 2, 2, 2, 2, 2, 2, 3, 3, 3, 3, 3, 21MedianSlide19
Median
: The middle value in a ranked distribution. If there is an even number of values, then take the average of the middle two values.
Raw Data: 2, 0, 1, 0, 2, 2, 1, 0, 0, 2, 1, 3, 3, 3, 2, 1, 3, 21, 1, 1, 0, 3, 1, 2, 2
Ranked
: 0, 0, 0, 0, 0, 1, 1, 1, 1, 1, 1, 1, 2, 2, 2, 2, 2, 2, 2, 3, 3, 3, 3, 3, 21MedianSlide20
Median
: The middle value in a ranked distribution. If there is an even number of values, then take the average of the middle two values.
Raw Data: 2, 0, 1, 0, 2, 2, 1, 0, 0, 2, 1, 3, 3, 3, 2, 1, 3, 21, 1, 1, 0, 3, 1, 2, 2
Ranked
: 0, 0, 0, 0, 0, 1, 1, 1, 1, 1, 1, 1, 2, 2, 2, 2, 2, 2, 2, 3, 3, 3, 3, 3, 21Median: 2MedianSlide21
US Dollars
(in millions)
MeanMean
Based on the Mean… College Students are Millionaires!Slide22
US Dollars
(in millions)
Median
Median
Based on the Median… College Students as a Group Aren’t WealthySlide23
US Dollars
(in millions)
MedianBased on the Median… College Students as a Group Aren’t Wealthy
MedianSlide24
Median
– Does not use all data,
but is robust; not affected by outliersMedianSlide25
Measures of Central Tendency – And Outliers
When there is an outlier, which measure of central tendency
can we generally count on to give us the best measure of what is typical?
Which measure should Susan report?Slide26
Measures of Central Tendency – And Outliers
When there is an outlier, which measure of central tendency
can we generally count on to give us the best measure of what is typical?
Which measure should Susan report?
Mean – Uses all data, but sensitive to outliersSlide27
Measures of Central Tendency – And Outliers
When there is an outlier, which measure of central tendency
can we generally count on to give us the best measure of what is typical?
Which measure should Susan report?
Mean
– Uses all data, but
sensitive to outliers
Mode
– Easily affected by small
changes in frequencySlide28
Measures of Central Tendency – And Outliers
When there is an outlier, which measure of central tendency
can we generally count on to give us the best measure of what is typical?
Which measure should Susan report?
Mean – Uses all data, but sensitive to outliersMode
– Easily affected by small
changes in frequency
Median
– Does not use all data,
but is robustSlide29
Real World Use
When there is an outlier, your reporting options are to report:
Median, or Median and MeanMeasures of Central Tendency – And OutliersSlide30
Real World Use
When there is an outlier, your reporting options are to report:
Median, or Median and MeanMeasures of Central Tendency – And OutliersIf you think the outlier does not belong in thedata set (i.e., was an error)… then consider also reporting the mean without the outlier.Slide31
Posted on
Flickr as fast food is the best! by Ebruli. Available under Creative Commons Attribution 2.0 Generic License to share and remix.Posted on Wikimedia Commons as Earth Western Hemisphere white background by Hansjorn. Available in the Public Domain.ReferencesSlide32
References
Posted on
Flickr as Money! by Tracy O. Available under Creative Commons Attribution-Share Alike 2.0 Generic License to share and remix.Posted on Wikimedia Commons as Bill Gates 2004 crop. Originally posted to Flickr by deVos. Available under Creative Commons Attribution-Share Alike 2.0 Generic License to share and remix.Slide33
Appendix: Online Resources
Mean, Median, and Mode Song
From LearningUpGrade.com; posted on YouTube.Description of Video: A basic overview of how to determine the mean, median and mode. Includes music and animation.
Length: 1m 33s
.View at tinyurl.com/yfsnmh9Comparing the Properties of the Mean and the Medianat Principles & Standards for School Mathematics Description of this Interactive Demonstration: Move the numbers around on the number line, and see the corresponding effect on the mean and median. How do outliers affect the mean and median?
Length: Interactive Demonstration
Participate at
tinyurl.com/33tngrSlide34
Appendix: Online Resources
Statistics: The Average
Posted by khanacademy on YouTube. Description of Video: A more in depth, college level, introduction to the mean, median, and mode. Note – starts with a blank screen, which is then written upon…
Length:
12m 35sView at tinyurl.com/ykbbvmjIt’s Not Hard (Averages Song)
Posted on YouTube by
jalapenojane
.
Description of Video
: This is just for fun…. Covers mean, median, and mode in a way that may leave you laughing aloud.
Length: 3m 49s
View at
tinyurl.com/yhc885wSlide35
Appendix: Creative Commons License
Creative Commons Attribution-Share
Alike 3.0 LicenseYou are free to share (copy, distribution and transmit the work) and to remix (to adapt the work) this
Powerpoint
Presentation What to Report When There is an Outlier by Robert G. Kelley, Ph.D. on the condition that you provide attribution (you must attribute the work in a manner specified by the author or licensor – but not in any way that suggests that they endorse you use of the work) and share alike (if you alter, transform, or build upon this work, you may distribute the resulting work only under the same, similar or compatible license) this work.Note that the online resources listed in the appendix are separate works from this Powerpoint presentation, and are not covered by this Creative Commons License.Please attribute this work to:
Robert G. Kelley, Ph.D. (www.miracosta.edu/home/rkelley)