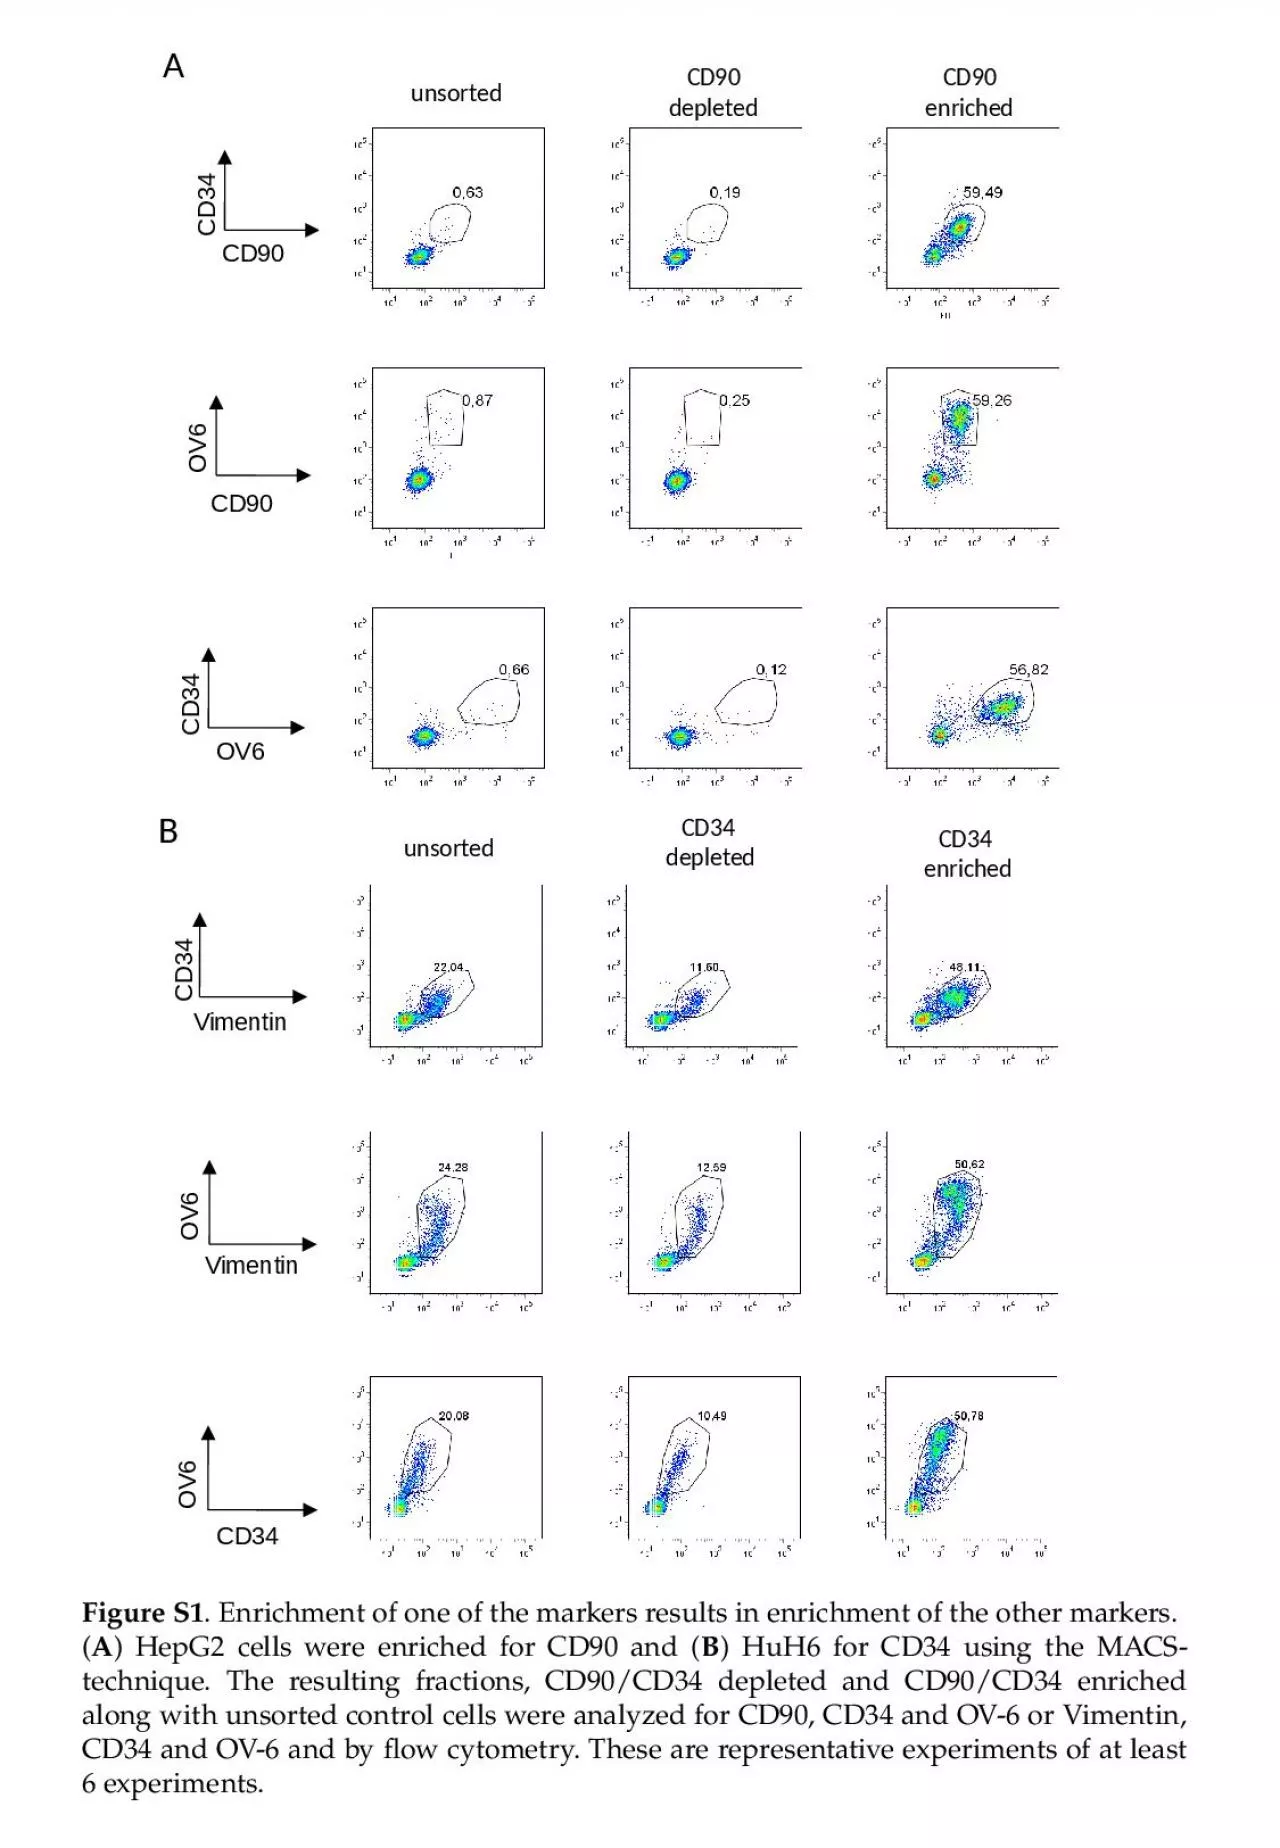
/
F igure  S1 . Enrichment of one of the markers results in enrichment of the other markers. F igure  S1 . Enrichment of one of the markers results in enrichment of the other markers.

F igure S1 . Enrichment of one of the markers results in enrichment of the other markers. - PowerPoint Presentation

candy
candy . @candy
Follow
64 views
Uploaded On 2024-01-03

F igure S1 . Enrichment of one of the markers results in enrichment of the other markers. - PPT Presentation

A HepG2 cells were enriched for CD90 and B HuH6 for CD34 using the MACStechnique The resulting fractions CD90CD34 depleted and CD90CD34 enriched along with unsorted control cells were analyzed for CD90 CD34 and OV6 or ID: 1037159

cd90 cells aag cd34 cells cd90 cd34 aag treated 5µg controls bv421igg cisplatin apctripleigg vimentin cancer enriched values performed

Share:

Link:

Embed:

Download Presentation from below link

Download Presentation The PPT/PDF document "F igure S1 . Enrichment of one of the m..." is the property of its rightful owner. Permission is granted to download and print the materials on this web site for personal, non-commercial use only, and to display it on your personal computer provided you do not modify the materials and that you retain all copyright notices contained in the materials. By downloading content from our website, you accept the terms of this agreement.


Presentation Transcript

1. Figure S1. Enrichment of one of the markers results in enrichment of the other markers.(A) HepG2 cells were enriched for CD90 and (B) HuH6 for CD34 using the MACS-technique. The resulting fractions, CD90/CD34 depleted and CD90/CD34 enriched along with unsorted control cells were analyzed for CD90, CD34 and OV-6 or Vimentin, CD34 and OV-6 and by flow cytometry. These are representative experiments of at least 6 experiments. CD34CD90OV6unsortedCD90 depletedCD90 enrichedOV6CD90CD34ACD34VimentinOV6CD34VimentinOV6unsortedCD34 depletedCD34 enrichedB

2. ABCD*********HepG2HuH6Figure S2. CD90-sorted cells have increased expression of pluripotency and EMT factors.(A) Gene expression was calculated for HepG2 in CD90 depleted (CD90-) and enriched (CD90+) fractions for Oct4, Nanog, c-myc, EpCAM, AFP and Albumin and (B) SNAIL1, TWIST1, Vimentin, E-Cadherin and Occludin and the same for HuH6 (C and D). The fold-change values of the CD90- population were normalized to 1 and the values of CD90+ were calculated in relation to the respective values of CD90-. The columns represent the mean with error bars depicting standard deviation from the mean. The experiment was repeated at least 6 times. A two-tailed Wilcoxon ranked test was performed in order to calculate the significance of the data (*p<0.05).

3. CD90 depletedCD90 enrichedRelative migration behaviourFigure S3. CD90-enriched cell fraction migrates to a higher extent.Migration assays were performed with CD90-MACS depleted and enriched cells as well as unsorted cells. 24hrs after incubation the migrated cells of all three groups were counted. The migrated cells of the unsorted group were set at 100% and the migrated cells of the CD90 depleted and enriched groups were then calculated in relation to the unsorted cells. The values presented are the mean with error bars depicting standard deviation from the mean. The experiment was performed 3 times.

4. CD34-BV421OV-6-APCCD34-BV421Vimentin-PEVimentin-PEOV-6-APCtripleIgG-BV421IgG-APCtripleIgG-BV421IgG-PEtripleIgG-APCIgG-PEcontrolCisplatin(2.5µg/mL)controlCisplatin(2.5µg/mL)controlCisplatin(2.5µg/mL)Figure S4. Background gating strategy of Cisplatin treated HuH6 cells. After 72hrs of Cisplatin treatment (2.5µg/mL), treated and controls cells were stained for CD34, OV-6 and Vimentin simultaneously (triple) or with IgG-controls coupled with the BV421, APC or PE fluophores.

5. CD34-BV421OV-6-APCCD34-BV421Vimentin-PEVimentin-PEOV-6-APCtripleIgG-BV421IgG-APCtripleIgG-BV421IgG-PEtripleIgG-APCIgG-PEcontrolCisplatin(2.5µg/mL)controlCisplatin(2.5µg/mL)controlCisplatin(2.5µg/mL)Figure S5. Background gating strategy of Cisplatin treated HepG2 cells. After 72hrs of Cisplatin treatment (2.5µg/mL), treated and controls cells were stained for CD34, OV-6 and Vimentin simultaneously (triple) or with IgG-controls coupled with the BV421, APC or PE fluophores.

6. CD34-BV421OV-6-APCCD34-BV421Vimentin-PEVimentin-PEOV-6-APCtripleIgG-BV421IgG-APCtripleIgG-BV421IgG-PEtripleIgG-APCIgG-PEcontrol17-AAG(100nM)control17-AAG(100nM)control17-AAG(100nM)Figure S6. Background gating strategy 17-AAG treated HuH6 cells. After 48hrs of 17-AAG treatment (100nM), treated and controls cells were stained for CD34, OV-6 and Vimentin simultaneously (triple) or with IgG-controls coupled with the BV421, APC or PE fluophores.

7. n.d.BAFigure S7. Effect of 17-AAG on HepG2 seems to be of general cytotoxic nature.HepG2 cells were treated with 0, 0.1 and 0.25µM 17-AAG, respectively. (A) After 48hrs, cell viability was measured in an MTT assay. The presented values with error bars depicting the standard deviation from the mean. The experiment was repeated 3 times. A two-tailed Wilcoxon ranked test was performed in order to calculate the significance of the data (*p<0.05). (B) Additionally, the cells were measured for CD34 expression and OV-6 binding by flow cytometry. The values represent the mean with error bars depicting the standard deviation from the mean. The assay was performed 3 times. A Dunn’s multiple comparisons test was performed in order to calculated the significance of the data (*p<0.05).nsnsns

8. tripleIgG-BV421IgG-APCCD34-BV421OV-6-APCCD34-BV421Vimentin-PEVimentin-PEOV-6-APCtripleIgG-BV421IgG-PEtripleIgG-APCIgG-PEcontrol17-AAG+CisplatincontrolcontrolFigure S8. Background gating strategy of 17-AAG+Cisplatin treated HuH6 cells. After 48hrs of 17-AAG treatment (100nM), cells were treated with Cisplatin (2µg/mL) for 72hrs. Control and treated cells and were stained for CD34, OV-6 and Vimentin simultaneously (triple) or with IgG-controls coupled with the BV421, APC or PE fluophores.17-AAG+Cisplatin17-AAG+Cisplatin

9. Gene nameForward primer (5‘-3‘)Reverse primer (5‘-3‘)SourceOct4GAGGCAACCTGGAGAATTTGCGGTTACAGAACCACACTCGNM_002701NanogGAACTCTCCAACATCCTGAACCGCGTCACACCATTGCTATTCNM_024865 c-mycCGGTGCAGCCGTATTTCTACCAGCAGCTCGAATTTCTTCCNM_001354870EpCAMCGCAGCTCAGGAAGAATGTGTGAAGTACACTGGCATTGACG Osta et al.AFPGGTGGTGGATGAAACATATGTTGCTTTTGCTTCACAAGGTTAATGAGYang et al. †AlbuminTGCACAGAATCCTTGGTGAATTCACGAGCTCAACAAGTGCYang et al. †SNAI1CTCTTTCCTCGTCAGGAAGCTAGGGCTGCTGGAAGGTAAACNM_005985Twist1CAAGCTGAGCAAGATTCAGACCCAGCTTGCCATCTTGGAGTCNM_000474VimentinTCCACGAAGAGGAAATCCAGGGCTTGGAAACATCCACATCNM_003380E-CadherinCCTGGGCAGAGTGAATTTTGGAAACCGTAGAGGCCTTTTGNM_004360OccludinGTCGAGGAGTGGGTTAAAAATGATGCCATGGGACTGTCAACNM_002538CD34CAACACCTAGTACCCTTGGAAGTACTGTCGTTTCTGTGATGTTTGTCheng et al.‡CD90ATCTCCTCCCAGAACGTCATCTCTGCACTGGAACTTGWoeller et al. ◊KRT14AGAGAAGAACCGCAAGGATGAATCTCCAGGTTCTGCATGGNM_000526 ACTBACTCTTCCAGCCTTCCTTCCTGTTGGCGTACAGGTCTTTGNM_001101Table S1: qPCR primers Osta, W.A.; Chen, Y.; Mikhitarian, K.; Mitas, M.; Salem, M.; Hannun, Y.A.; Cole, D.J.; Gillanders, W.E. EpCAM is overexpressed in breast cancer and is a potential target for breast cancer gene therapy. Cancer Res. 2004, 64, 5818–5824.†Yang, Z.F.; Ho, D.W.; Ng, M.N.; Lau, C.K.; Yu, W.C.; Ngai, P.; Chu, P.W.K.; Lam, C.T.; Poon, R.T.P.; Fan, S.T. Significance of CD90+ cancer stem cells in human liver cancer. Cancer Cell 2008, 13, 153–166.‡Chen, Q.; Khoury, M.; Limmon, G.; Choolani, M.; Chan, J.K.Y.; Chen, J. Human fetal hepatic progenitor cells are distinct from, but closely related to, hematopoietic stem/progenitor cells. Stem Cells 2013, 31, 1160–1169.◊Woeller, C.F.; O’Loughlin, C.W.; Pollock, S.J.; Thatcher, T.H.; Feldon, S.E.; Phipps, R.P. Thy1 (CD90) controls adipogenesis by regulating activity of the Src family kinase, Fyn. FASEB J. 2015, 29, 920–931.