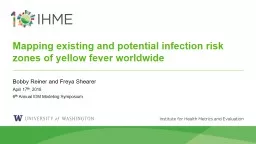
/
Mapping existing and potential infection risk zones of yellow fever worldwide Mapping existing and potential infection risk zones of yellow fever worldwide

Mapping existing and potential infection risk zones of yellow fever worldwide - PowerPoint Presentation

candy
candy . @candy
Follow
342 views
Uploaded On 2022-06-14

Mapping existing and potential infection risk zones of yellow fever worldwide - PPT Presentation

Bobby Reiner and Freya Shearer April 17 th 2018 6 th Annual IDM Modeling Symposium Outline Estimating yellow fever vaccination coverage Data collation amp data issues Age cohort models ID: 917961

yellow fever estimating vaccination fever yellow vaccination estimating coverage risk results data zones infection individuals age vaccine untargeted 000

Share:

Link:

Embed:

Download Presentation from below link

Download Presentation The PPT/PDF document "Mapping existing and potential infection..." is the property of its rightful owner. Permission is granted to download and print the materials on this web site for personal, non-commercial use only, and to display it on your personal computer provided you do not modify the materials and that you retain all copyright notices contained in the materials. By downloading content from our website, you accept the terms of this agreement.


Presentation Transcript

Slide1

Mapping existing and potential infection risk zones of yellow fever worldwide

Bobby Reiner and Freya Shearer

April 17

th

, 2018

6

th

Annual IDM Modeling Symposium

Slide2

Outline

Estimating yellow fever vaccination coverage

Data collation & data issues

Age cohort models

Results

Estimating yellow fever infection risk zones

Data collation

Spatial model

Results

Slide3

Estimating yellow fever vaccination coverage

3

Slide4

Estimating yellow fever vaccination coverage

Data

collation

4

A systematic literature search was used to identify

Routine vaccination

Mass preventative campaigns

Outbreak response campaigns

Traveler vaccination

Data on age range of vaccination was tracked

When available, spatial extent was recordedNon-survey data was adjusted for biases

Slide5

Estimating yellow fever vaccination coverage

Data

collation

5

The Brazilian national immunization program information system provided us with much more detailed data

Spatial scale: Admin 2

Temporal scale: 2006-2015

Age bins:

1 year bins from 0-4

5 year bins from 5-14

15 to 5960+We assumed this data incorporated both routine and mass vaccination

Slide6

Estimating yellow fever vaccination coverage

Data

issues

6

When more vaccine doses were said to have been distributed than there were people in the population (after bias correction), we set doses to the population

When age was omitted, we assumed all ages were equally likely

When age was listed as “children”, we assumed age was < 5

There was almost always no information on which people/children were

vaccinated

Slide7

Estimating yellow fever vaccination coverage

Age cohort models

7

Using age, time, and location-specific vaccination coverage and population, we tracked each age cohort (from 0 to 99 years) in every district through time

Started in 1871 to track coverage of individuals

We assumed mortality rate for vaccinated and unvaccinated individuals was the same

We assumed there was no movement

Slide8

Estimating yellow fever vaccination coverage

Age cohort models

8

It was unclear (and unlikely) if vaccination campaigns only targeted those who had not previously been vaccinated. We developed three vaccination scenarios

Targeted

– Vaccination history was taken into account and only unvaccinated individuals received

vaccine [most optimistic scenario]

Untargeted, unbiased

– Vaccination history was not taken into account,

but

all individuals are equally likely to have received the vaccine

Untargeted, biased

– Vaccination history was not taken into account

and

those who had already been vaccinated were more likely to receive vaccine than unvaccinated individuals [most conservative scenario]

Slide9

Estimating yellow fever vaccination coverage

Results

9

Untargeted, unbiased vaccine strategy

Slide10

Estimating yellow fever vaccination coverage

Results

10

Untargeted, unbiased vaccine strategy

Slide11

Estimating yellow fever vaccination coverage

Results

11

Untargeted, unbiased vaccine strategy

Slide12

12

Slide13

Estimating yellow fever vaccination coverage

Results

13

2016 Untargeted, unbiased vaccine strategy

Slide14

Estimating yellow fever vaccination coverage

Results

14

We calculated the estimated number of individuals that still need the vaccine to achieve a population coverage threshold of 80% by district (WHO recommendation)

We further broke this down either overall, or only those who live in an “at risk” district

Targeted

529,900,000 individuals overall, 393,700,000 individuals in “at risk” districts

Untargeted, unbiased

568,200,000

individuals overall,

412,800,000

individuals in “at risk”

districts

Untargeted, biased

– 669,500,000 individuals overall, 472,000,000 individuals in “at risk” districts

Slide15

Estimating yellow fever vaccination coverage

Results

15

There is an ongoing outbreak in coastal Brazil.

In particular,

Mairiporã

in São Paulo,

Valença

and

Teresópolis

in Rio de Janeiro, and Belo Horizonte in Minas Gerais.

Slide16

Estimating yellow fever vaccination coverage

Results

16

There is an ongoing outbreak in coastal Brazil.

In particular,

Mairiporã

in São Paulo,

Valença

and

Teresópolis

in Rio de Janeiro, and Belo Horizonte in Minas Gerais.

Municipality

Conservative

Untargeted

Optimistic

Cases (Deaths)

Mairiporã

8% (68,902)

41% (36,883)

58% (21,399)

61 (21)

Valença

17% (49,217)

49% (24,049)

65% (11,742)

18 (7)

Teresópolis

8

% (

132,560)

40

% (

73,137)

55

% (

45,451)

Belo Horizonte

30% (1,273,264)

72% (206,960)

95% (0)

50 (24)

Slide17

Estimating yellow fever infection risk zones

17

Slide18

Estimating yellow fever infection risk zones

Data collation

18

A database of locations where at least one symptomatic YFV case was reported was assembled.

Locations were recorded either to 5km

2

resolution (when finer resolution was provided) or to finest administrative unit if

nesseasary

Of the 1,154 records in the final dataset:

402 were PCR confirmed

444 were serologically confirmed

308 were reported as “confirmed cases” without specifying the diagnostic test used.

A sensitivity analysis was conducted where only PCR-confirmed data was used

Slide19

Estimating yellow fever infection risk zones

Data collation

19

Grey areas represent contemporary risk zones as defined by

Jentes

et al

Slide20

Estimating yellow fever infection risk zones

Spatial model

20

Our goal was to create a single, temporally static map estimating relative risk of YFV infection

We used 10 spatial covariates

As well as our YFV vaccination coverage estimate

We fit an inhomogeneous Poisson point process model using a Boosted Regression Tree approach

Slide21

Estimating yellow fever infection risk zones

Results

21

Slide22

Estimating yellow fever infection risk zones

Results

22

Slide23

Estimating yellow fever infection risk zones

Results

23

Slide24

Estimating yellow fever infection risk zones

Results

24

Slide25

Estimating yellow fever infection risk zones

Results

25

Slide26

Estimating yellow fever infection risk zones

Results

26

Slide27

Conclusions

27

We estimated that vaccination coverage levels achieved by 2016 avert between 94,000 and 119,000 cases of yellow fever within risk zones, based on either optimistic or conservative vaccination scenarios.

High-quality spatial data on yellow fever are lacking, largely because of diagnostic complexity and limitations of health-care systems in many affected countries.

Although our vaccination map indicated poor coverage in many of the locations experiencing YFV cases in Brazil, some of those same locations were not estimated to have a high likelihood of cases.

Slide28

Thank you!

Questions?

28