PPT-Biomarker Platform for Commercial Aquaculture Feed Development project:
Author : celsa-spraggs | Published Date : 2019-02-01
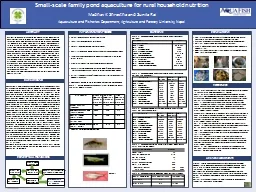
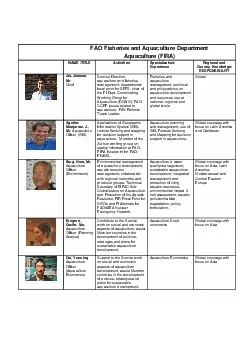
New findings and methods for feed engineering to face present and future challenges in salmon aquaculture Presenter Albert Caballero Solares PhD Collaborators
Presentation Embed Code
Download Presentation
Download Presentation The PPT/PDF document "Biomarker Platform for Commercial Aquacu..." is the property of its rightful owner. Permission is granted to download and print the materials on this website for personal, non-commercial use only, and to display it on your personal computer provided you do not modify the materials and that you retain all copyright notices contained in the materials. By downloading content from our website, you accept the terms of this agreement.
Biomarker Platform for Commercial Aquaculture Feed Development project:: Transcript
Download Rules Of Document
"Biomarker Platform for Commercial Aquaculture Feed Development project:"The content belongs to its owner. You may download and print it for personal use, without modification, and keep all copyright notices. By downloading, you agree to these terms.
Related Documents