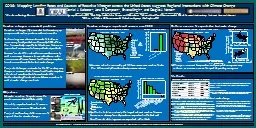
/
Future changes in land use-related emissions and their impacts on air/water quality and Future changes in land use-related emissions and their impacts on air/water quality and

Future changes in land use-related emissions and their impacts on air/water quality and - PowerPoint Presentation

celsa-spraggs
celsa-spraggs . @celsa-spraggs
Follow
379 views
Uploaded On 2018-11-09

Future changes in land use-related emissions and their impacts on air/water quality and - PPT Presentation

Yilin Chen Huizhong Shen Armistead G Russell Talat Odman JhihShyang Shih Juha Siikamäki Dallas Burtraw Charles Driscoll Richard Smith Shuai Shao Speaker M Talat Odman ID: 725457

emissions nh3 model climate nh3 emissions climate model change impacts esp land plants soil cmaq deposition cropland temperature emission

Share:

Link:

Embed:

Download Presentation from below link

Download Presentation The PPT/PDF document "Future changes in land use-related emiss..." is the property of its rightful owner. Permission is granted to download and print the materials on this web site for personal, non-commercial use only, and to display it on your personal computer provided you do not modify the materials and that you retain all copyright notices contained in the materials. By downloading content from our website, you accept the terms of this agreement.


Presentation Transcript

Slide1

Future changes in land use-related emissions and their impacts on air/water quality and reactive nitrogen deposition

Yilin Chen, Huizhong Shen, Armistead G. Russell, Talat Odman, Jhih-Shyang Shih, Juha Siikamäki, Dallas Burtraw, Charles Driscoll, Richard Smith, Shuai Shao

Speaker: M. Talat Odman

Community Modeling and Analysis System Conference

Chapel Hill, NCSlide2

Land Use Change and Air Quality

Why land use change matters to air and water quality:

Emissions/discharge linkagesIncreasing component as industrial and mobile sources are reducedHeating/cooling (e.g., urban heat island)Directly affected by future global changeImpacts on PM, Ozone, NOx, reactive nitrogen deposition …HealthWelfareOften overlookedAcidic deposition (N&S)Terrestrial nitrogen enrichment (NR)Slide3

Study Objectives

Identify the future changes in emissions from land use-related source changes and the impacts of global change with a focus on reactive nitrogen (N

R);Cropland NH3 emissionsForest nitrogen (e.g., fires)Biogenic emissionsDevelop an integrated modeling framework to investigate the potential impacts of land-use and climate-related changes on air pollution, atmospheric deposition and associated impacts on water quality and sensitive ecosystems;Identified as a need in last NOX-SOX secondary NAAQS reviewIdentify effective mitigation strategies with benefits in multiple environmental media.Slide4

CMAQ

with

FEST-C and BEISFEST-C: Fertilizer Emission Scenario Tool for CMAQ, estimates cropland NH3 emissions;BEIS: Biogenic Emission Inventory System, estimates biogenic emissions;CMAQ: air quality modelling, provide deposition fields for SPARROW and

PnET-BGC inputs.SPARROW: USGS

SPAtially Referenced Regressions On Watershed attributesWater quality assessment

Nationwide application, watershed level scalePnET-BGC: an integrated biogeochemical model to simulate forest and aquatic ecosystems

Two hotspots: Adirondacks and Great Smokey MountainStream chemical composition

Models appliedSlide5

Climate projections

Two sets of meteorological fields under both Representative Concentration Pathway 4.5 (

RCP4.5, a scenario with moderate temperature increase) and RCP8.5 (a scenario with intensive temperature increase) scenariosMCIP: 36km spatial resolution, based on output from the Community Earth System Model (CESM1) downscaled using WRF spectral nudgingMACA (Multivariate Adaptive Constructed Analogs) dataset: major components at a high spatial resolution (6 km) and monthly temporal resolutionMulti-model projections (17 climate models)

Components: temperature (T, Tmax, and Tmin

), wind speed, precipitation, humidity, evaporation

Data Preparation

2028-2032

2048-2052

2098-2099

2008-2012

MACA: 2006-2100, monthly

2100

2010

2080

2030

2040

2050

2060

2070

2090

2020

2006

MCIP: four periods

CMAQ

SPARROW PnET-BGC

RCP4.5

RCP8.5Slide6

Modeling Framework: Future projection

Note:

CCSM: Community Climate System Model

SSP: Shared Socioeconomic PathwaySlide7

Primary results shown

Climate change impacts on NH

3 emissions from soil and plants (ESPNH3), mainly over cropland, and implications for crop production and nitrogen deposition.

Project in progress: Preliminary ResultsSlide8

Model Configurations and Evaluation

CMAQv5.0.2 with FEST-C v1.1

Considering recent updates, will rerun using CMAQv5.3 and FEST-C v1.4.Both CMAQ with and without NH3 BIDI exchange were applied, model with the module reduces model bias for the compounds directly related with NH3.

NMB

Base

BiDi

Observed

CMAQ-BIDI

units

NO

2

CONC

-3%

-2%

9.1

8.9

ppbV

NH

3

CONC

-52%

-30%

2.0

1.4

ppbV

HNO

3

DRY DEP

66%65%3.4 5.6 kg/ha/yrNH

4

DRY DEP-14%

-5%0.25 0.24 kg/ha/yrNO3 DRY DEP

499%518%0.24 1.51 kg/ha/yrNH4 WET DEP

-47%

-32%2.7 1.8 kg/ha/yrNO3 WET DEP-36%

-36%

6.9

4.4

kg/ha/yrTotal NO

3 DEP

10%9%

10 11

kg/ha/yrTotal NH

4 DEP-41%-25%2.8 2.1

kg/ha/yr

Model Evaluation and Version ComparisonSlide9

NH

3

emission intensity in cropland and other land cover typeshigher emission intensities over croplandshigher emission-to-temperature sensitivities over other land cover types

NH

3

emission from soil and plants (

ESPNH3)

NH

3

emissions

from

soil

and

plants

(

ESP

NH3

) over different land use typesSlide10

Observed evidence

NH

3 concentration peaked in 2012 in the Midwest United Stateslikely due to abnormal climate conditions (highest temperature in the last 123 year and dryer-than-normal conditions)Attributed to multiple factors (emissions, gas-particle partitioning, deposition)

The year-to-2012 ratios of annual mean NH

3

concentrations in the Midwest reported by Ammonia Monitoring Network

Climate change impacts on NH

3

emissions from soil and plants (

ESP

NH3

)Slide11

Used FEST-C-CMAQ to investigate how climate impacts NH

3

emissions and atmospheric levels and to see how well the model captures the observationsBy comparing the model (FEST-C-CMAQ-BIDI) results in 2011 and 2012sensitivities of NH3 concentration to temperature (+0.18 ppbK-1 in the Midwest; +0.33 ppbK-1 at the site locations) in line with observations (+0.15 ppbK-1 and +0.34 ppb

K-1, respectively)By replacing ESPNH3 in 2012 with that in 2011cropland NH3 emissions contributed 40% of the concentration increase.

Modelled increases in NH

3

concentrations between 2011 and 2012

a. All factors (emissions, gas-particle partitioning, removal processes)

b. Only emissions

Climate change impacts on NH

3

emissions from soil and plants (

ESP

NH3

)Slide12

Optimizing agricultural management can reduce emission-to-temperature sensitivity in cropland in warmer conditions

ESP

NH3~T function for natural landscapes, often adopted for cropland:

Relationship obtained from natural circumstances

Relationship over cropland considering impacts of agricultural management

ESP

NH3

~ change in annual mean

T

Sensitivity ~ change in annual mean

T

Climate change impacts on NH

3

emissions from soil and plants (

ESP

NH3

)Slide13

Multi-model projections

Regression models considering land cover types and climate variables (

T, wind speed, and precipitation) established based on the integrated model outputs.Multi-model projections using the outputs of 17 climate models

Climate change impacts on NH

3

emissions from soil and plants (

ESP

NH3)Slide14

Spatial distributions of

ESP

NH3 changes reflected by the multi-model meansOverall increase in ESPNH3 between 2010 and 2100:30% (26-33% as 95% confidential interval) in RCP4.5;99% (90%-108%) in RCP8.5.

Spatial changes in

ESP

NH3

by the end of the twenty-first century due to climate change only.

Climate change impacts on NH

3

emissions from soil and plants (

ESP

NH3

)Slide15

Implications

Loss of synthetic N fertilizer: from 8% in 2010 to 14% in 2100 (RCP8.5);

Crop yield loss: 460 Gg N/year;Atmospheric burden of NH3/NH4+: increases by 20%N deposition over sensitive regions: increases by 10%Mitigation measures

Replacement of urea with non-urea fertilizers (RU): 500 Gg/year reduction in ESPNH3;

Urea application with irrigation (UIR): -180 Gg/yearApplication of urea inhibitor (UIN): -280 Gg/yearDeep placement of fertilizers (DP): -700 Gg/year

The most effective strategy combining RU and DP measures with best management practices is estimated to reduce the

ESP

NH3

by ~50% (1020 Gg/year), fully compensating for the negative impacts of warming-induced

ESP

NH3

increase on the atmosphere and ecosystems

Climate change impacts on NH

3

emissions from soil and plants (

ESP

NH3

)Slide16

Summary

Multiple causes of potential NH

3 (and NR) changesLand useClimate

CMAQ-FEST-C appears to capture NH3 sensitivity to meteorology,

Modeled vs Observed:Midwest: +0.18 ppb

K-1

vs +0.15 ppbK

-1Site locations: +0.34 ppb

K

-1

vs +0.33 ppb

K

-1

Cropland NH

3

emissions expected to significantly increase in response to

Climate warming,

Land use change

Changes impact

N cycle

Sensitive ecosystemsThreaten food securitySlide17

Acknowledgement

EPA grant number R835880

Contacts:Armistead G. Russell: ted.russell@gatech.eduYilin Chen: ychen870@gatech.edu

Huizhong Shen: hshen73@gatech.edu

R835880

This presentation was made possible in part by USEPA. Its contents are solely the responsibility of the grantee and do not necessarily represent the official views of the funding sources and those sources do not endorse the purchase of any commercial products or services mentioned in the publication.