PPT-Histograms of Oriented Gradients for Human Detection

Author : celsa-spraggs | Published Date : 2015-10-28

Navneet Dalal and Bill Triggs CVPR 2005 Another Descriptor Overview 1 Compute gradients in the region to be described 2 Put them in bins according to orientation

Presentation Embed Code

Download Presentation

Download Presentation The PPT/PDF document "Histograms of Oriented Gradients for Hum..." is the property of its rightful owner. Permission is granted to download and print the materials on this website for personal, non-commercial use only, and to display it on your personal computer provided you do not modify the materials and that you retain all copyright notices contained in the materials. By downloading content from our website, you accept the terms of this agreement.

Histograms of Oriented Gradients for Human Detection: Transcript


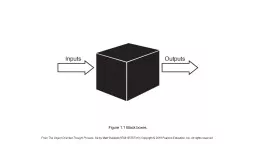
Navneet Dalal and Bill Triggs CVPR 2005 Another Descriptor Overview 1 Compute gradients in the region to be described 2 Put them in bins according to orientation 3 Group the cells into large blocks. g BinetCauchy kernels However such approaches are only applicable to time series data living in a Euclidean space eg joint trajectories extracted from motion capture data or feature point trajectories extracted from video Much of the success of rec Understanding Histograms. Histograms are a graphic representations (a picture) of the tonal value for each pixel in your photo. . The horizontal axis of the . histogram . corresponds to a gradient of increasing lightness from black to white (left to right). P. . Felzenszwalb. Generic object detection with deformable part-based models. Challenge: Generic object detection. Histograms of oriented gradients (HOG). Partition image into blocks at multiple scales and compute histogram of gradient orientations in each block. Properties . on Convective Initiation in the Sahel. Amanda . Gounou. (1). , Christopher Taylor. (2) . , Francoise . Guichard. (1). , Phil Harris. (2) . , Richard Ellis. (2). , Fleur . Couvreux. (1). and Martin De . Species – latitude relationship of birds across the New World show the typical pattern of increased species diversity towards the equator.. 0. 300. 600. 900. 1200. 1500. -80. -40. 0. 40. 80. Latitude. (Slides borrowed from various presentations). Image representations. Templates. Intensity, gradients, etc.. Histograms. Color, texture, SIFT descriptors, etc.. Space Shuttle Cargo Bay. Image Representations: Histograms. 4. 3. 2. 1. 0. In addition to level 3.0 and above and beyond what was taught in class,  the student may:. · Make connection with other concepts in math. · Make connection with other content areas.. Why?. 8/27/2018. 1. Object-oriented software development. What am I expected to know?. From 1250, the following items represent a . partial list. of things with which you are expected to be comfortable. . Semantics, Processes, Agents. – Munindar P. Singh and Michael N. Huhns, Wiley, 2005. Chapter 15. 2. Service-Oriented Computing: Semantics, Processes, Agents . - Munindar Singh and Michael Huhns. Highlights of this Chapter. From The Object-Oriented Thought Process, 5/e by Matt Weisfeld (9780135767313) Copyright © 2019 Pearson Education, Inc. All rights reserved Figure 1.1 Black boxes. From The Object-Oriented Thought Process, 5/e . SYFTET. Göteborgs universitet ska skapa en modern, lättanvänd och . effektiv webbmiljö med fokus på användarnas förväntningar.. 1. ETT UNIVERSITET – EN GEMENSAM WEBB. Innehåll som är intressant för de prioriterade målgrupperna samlas på ett ställe till exempel:. Thomas Gruber1 Reiner Rummel1 Radboud Koop21 Institut fr Astronomische und Physikalische Geodsie IAPG Technische Universitt Mnchen Germany e-mail ThomasGruberbvtu-muenchende 2 SRON Netherlands Institu Applications. 报告人:程明明. 南开大学、计算机与控制工程学. 院. http://mmcheng.net/. Contents. Global . contrast based salient region . detection. ,. PAMI 2014. BING: Binarized Normed Gradients for Objectness Estimation at . Going to the movies – Frequency tables. Class interval. Frequency. 155-<160. 3. 160-<165. 2. 165-<170. 9. 170-<175. 7. 175-<180. 10. 180-<185. 5. How is this different to other frequency tables you’ve seen?.

Download Document

Here is the link to download the presentation.
"Histograms of Oriented Gradients for Human Detection"The content belongs to its owner. You may download and print it for personal use, without modification, and keep all copyright notices. By downloading, you agree to these terms.

Related Documents