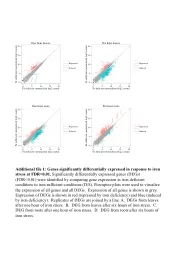
/
Identification and analysis of differentially expressed gen Identification and analysis of differentially expressed gen

Identification and analysis of differentially expressed gen - PowerPoint Presentation

celsa-spraggs
celsa-spraggs . @celsa-spraggs
Follow
396 views
Uploaded On 2016-10-11

Identification and analysis of differentially expressed gen - PPT Presentation

Saccharomyces cerevisiae Group Populus Petra van Berkel Casper Gerritsen Astri Herlino Brian Lavrijssen Dataset of S cerevisiae Data generated by Nookaew et al 2012 ID: 474436

length genes top expressed genes length expressed top gene transcript content regulated 100 process 2012 file glucose amp fold

Share:

Link:

Embed:

Download Presentation from below link

Download Presentation The PPT/PDF document "Identification and analysis of different..." is the property of its rightful owner. Permission is granted to download and print the materials on this web site for personal, non-commercial use only, and to display it on your personal computer provided you do not modify the materials and that you retain all copyright notices contained in the materials. By downloading content from our website, you accept the terms of this agreement.


Presentation Transcript

Slide1

Identification and analysis of differentially expressed genes in Saccharomyces cerevisiae.

Group Populus:Petra van BerkelCasper GerritsenAstri HerlinoBrian LavrijssenSlide2

Dataset of S. cerevisiaeData generated by

Nookaew et al (2012)Two conditions:Glucose excess (Batch) & Glucose limited (Chemostat)3 Biological replicates per condition RNA-seq data:12 Files 3 Sets of Paired-end reads per condition

Pipeline for differential gene expression analysisSlide3

TopHat – Cufflinks analysisProtocols based on Trapnell

et al (2012)75% of reads mappedPlots based on Cuffdiff gene expression outputSlide4

Cuffdiff output

5800 genes with FPKM values Q-value threshold based on Nookaew et al (2012)

Data Summary

Q-value < 0.05

Q-value < 1e-5

Significant differentially

expressed

2560

1293

FPKM

> 0 and value_2 > 0

2554

1292

log2(fold change) > 1

735

516

log2(fold change) < -1

510

410

log2(fold change) > 3

177

151

log2(fold change) > -2

44

33Slide5

Validation of TopHat - CufflinksValidation of selection

Using ExcelLiterature studyBoer et al (2003)Influence of C, N, P and S limitationMicroarray analysis > 68 out of 151 significantly upregulated> 9 out of 33 significantly downregulatedMore or less same genes found in other papersSlide6

Expression network up

Up regulated genes

mrnet method in R

Number of Nodes = 57

Number of Edges = 1560 Slide7

Expression network down

Down regulated genesmrnet method in R

Number of Nodes = 33

Number of Edges = 513Slide8

GO Terms and GO EnrichmentR version 2.15.0 (2012-03-30)

Packages:biomaRt: Ensembl gene 69, S. cerevisiae EF3 org.Sc.sgd.dbGOstatsRgraphvizGO enrichment:

8419 genes in the universe (org.Sc.sgdPMID2ORF)

Threshold: p-value < 10

-4Slide9

GO TermsDown regulated

32 genes  29 genes with 208 GO terms (3 genes are not annotated)Up regulated133 genes  113

genes with 855 GO terms (20 genes are not annotated)

Gene

GO ID

Description

HXT3

GO:0006810

,

GO:0016020

,

GO:0016021

,

GO:0005215

,

GO:0055085

Low affinity glucose transporter

HXT4

GO:0006810

,

GO:0055085

,

GO:0022891

,

GO:0005215

, GO:0022857 High-affinity glucose transporter

Gene

GO ID

Description

RGI2

-

Protein of unknown function involved in energy metabolism under respiratory conditions

SPG4

-

Protein required for survival at high temperature during stationary phase

JEN1

GO:0097079

,

GO:0015355

,

GO:0022857

,

GO:0016021

,

GO:0034219

Monocarboxylate

/proton

symporter

of the plasma membraneSlide10

GO Enrichment

Down regulatedBiological process: not foundUp regulated

GOBPID

Pvalue

OddsRatio

ExpCount

Count

Size

Term

GO:0055114

2.02E-10

4.98

7.66

29

415

oxidation-reduction process

GO:0072329

2.41E-10

33.95

0.46

9

23

monocarboxylic acid catabolic process

GO:0006091

1.70E-09

6.00

4.40

21

221

generation of precursor metabolites and energy

GO:0006099

3.75E-09

22.61

0.60

9

30

tricarboxylic acid cycle

GO:0009109

3.75E-09

22.61

0.60

9

30

coenzyme catabolic processSlide11

Biological process of up regulated genesSlide12

Validation: Yeast genome databaseProblem: Not well annotated because the

biomaRt was not updated to Ensembl gene 70, S. cerevisiae EF4 Slide13

Top 100gffread: make the transcripts

fasta fileDetermine the top 100 highest and lowest expressed genes for the two conditions R: order cuffdiff output on FPKM value (4 files)Take out the genes with FPKM = 0Slide14

Top 100Top genes: G3P dehydrogenase,

F16P aldolase, Ribosomal subunit proteinBottom genes: dubious transcript, retro transposon, etc..Slide15

GC-content & transcript lengthDetermine GC-content and transcript lengthImport top 100 genes files

For each file check the genes in top 100 file in transcripts.fa and count GC content and the transcript lengthSlide16

GC-content & transcript lengthHighly expressed in batch: Length: 515.19 GC: 0.43 Lowly expressed in batch:

Length: 831.46 GC: 0.41 Highly expressed in chemostat: Length: 556.65 GC: 0.43 Lowly expressed in chemostat: Length: 727.29 GC: 0.41 Slide17

GC-content & transcript lengthShort sequence length!mainly in highly expressed genes, gives unrealistic view of codon usage and intron length

These are often ribosomal subunit proteinsSlide18

Intron length

Genes.gtf as inputCreate an indexfile

Look for the interesting genes

Print them to an outputfile

Calculate average

file

mean

intron

length

introns_hi1.out

429.455

introns_hi2.out

440.125

introns_low1.out

60.6667

introns_low2.out

43.5Slide19

Codon usageMethod (

perl script):Input are top high and low expressed genesBuild gene ID list and codons list and retrieve sequencesCount codon usage and calculate RSCU and average RSCUSlide20

ConclusionThe up and down regulated genes are involved in carbon metabolismHighly expressed genes are involved in carbon metabolism or are ribosomal

subunit proteins