/
November 14,  2018 Educational Attainment & Economic Prosperity November 14,  2018 Educational Attainment & Economic Prosperity

November 14, 2018 Educational Attainment & Economic Prosperity - PowerPoint Presentation

celsa-spraggs
celsa-spraggs . @celsa-spraggs
Follow
353 views
Uploaded On 2018-11-20

November 14, 2018 Educational Attainment & Economic Prosperity - PPT Presentation

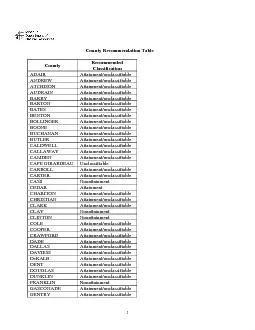
Educational Attainment and Economic Prosperity Agenda State Goals amp Trends Demographic Trends Understanding the Need and Impact of Attainment Reaching the Goal Benefits of Postsecondary Attainment ID: 731062

source virginia year attainment virginia source attainment year county public data postsecondary school report state education students educational graduates

Share:

Link:

Embed:

Download Presentation from below link

Download Presentation The PPT/PDF document "November 14, 2018 Educational Attainmen..." is the property of its rightful owner. Permission is granted to download and print the materials on this web site for personal, non-commercial use only, and to display it on your personal computer provided you do not modify the materials and that you retain all copyright notices contained in the materials. By downloading content from our website, you accept the terms of this agreement.


Presentation Transcript

Slide1

November 14, 2018

Educational Attainment & Economic Prosperity

Educational Attainment

and Economic ProsperitySlide2

AgendaState Goals & TrendsDemographic Trends

Understanding the Need and Impact of AttainmentReaching the GoalBenefits of Postsecondary Attainment

Economic

Societal Benefits

Reaching the Goal

1Slide3

State Postsecondary Goals & DEMOGRAPHIC Trends2Slide4

GoalsThe Virginia Plan for Higher Education: Be the best-educated state by 203070 percent of adults with high quality credential or degree, 1.5 million awards

What are the goals/priorities? Access/affordability Student success and completion

Traditionally underserved populations

Innovation and efficiency

Workforce needs/economic development/Research

3Slide5

4

Virginia’s goal to be best-educated stateSlide6

5Source: American Community Survey Data, 2016

Overall population change is increasing about the same as the national average, but there are differences across age, racial/ethnic groups, and

regionsSlide7

While younger aged Virginians make up the largest proportion of total residents, seniors and older workers represent fastest growing population

6Slide8

And Hispanic residents represent the fastest growing demographic population7

Source: American Community Survey Data, 2016Slide9

While Virginia is among the top 10 States in levels of attainment…8Slide10

…Within these total figures, there are stark differences in educational attainment among different populations. Virginia’s Black, Hispanic and Native American populations are on average ~20 points behind the White majority population.

9Slide11

Source: Lumina Foundation

There are also significant regional disparities across the state

10

Sussex – 12.1%

Falls Church City 84.5%

Source: Lumina Foundation

http://strongernation.luminafoundation.org/report/2017/#nation

Listing by locality provided in appendix

Regional DisparitiesSlide12

There are differences in the rates of working age populations with some college, but no degree by race.11Slide13

BENEFITS OF POSTSECONDARY ATTAINMENT12Slide14

Economic ImpactEducational attainment data are a key component to many state rankings (Best State for Business, Best State to Live and Raise a Family)A one point increase in the percentage of postsecondary educated people lifts their wages 1.5%, and the earning of other citizens by 1.1

%A one point increase in the percentage of people with post-secondary degrees and credentials increases overall economic growth over ten years by one–half percentage

point

13Slide15

Individuals with postsecondary credentials typically earn higher income and are more likely to be employed

14

Source: American Community Survey Data, 2016Slide16

Attainment

Impacts

Income

15.1

% to

20%

20.1% to

25%

25.1% to

30%

30.1% to

35%

35% or

higher

EDUCATIONAL

ATTAINMENT

AND

PERSONAL

INCOME,

BY

VIRGINIA REGION,

2010-2014

Percentage

of

Population with

a

Bachelor’s

Degree

or

Better

11.1% to

15%

15

S

out

hw

e

s

t

$32,561

Southside

$32,160

Central

$48,044

West

Central

$37,808

Valley

$38,056

Northern

$65,296

Hampton

Roads

$44,790

Prepared by the Council

on

Virginia’s Future,

2017

, Using the nine cultural regions designated for its work

.

Eastern

$40,781

15Slide17

16Societal Benefits

Notes: Public Assistance = any public assistance in past 22 months Supplementary Security Income = Social Security for those with  disabilities preventing them from working, and their dependents in  past 22 months

Source: American Community Survey Data, 2016Slide18

17Benefits to the Commonwealth

Source:

It’s Not Just the Money,

Lumina Foundation

https://www.luminafoundation.org/resources/its-not-just-the-money

Slide19

18Benefit to Individuals & Communities

79%

more likely to volunteer

Individuals with an associate degree or higher are…..

30%

more likely to vote in an election

38%

more likely to have health benefits

…than individuals with a high school diploma

Source:

It’s Not Just the Money,

Lumina Foundation

https://www.luminafoundation.org/resources/its-not-just-the-money

Slide20

Reaching the Goal19Slide21

By 2020, 67% of jobs in Virginia will require postsecondary education20

Source: Georgetown Center on Education and the Workforce, Projections of Jobs through 2020,

https://cew.georgetown.edu/cew-reports/recovery-job-growth-and-education-requirements-through-2020/

Slide22

21

Source: Lumina Foundation

http://strongernation.luminafoundation.org/report/2017/#nation

Note: Certificate and credential data based on estimates developed by Georgetown Center on Education and Workforce

Virginia’s educational attainment rate ranks 6

th

in the nation for working-aged adults

Virginia Compared to the Nation and Other States

However, Virginia’s educational attainment rate ranks 11

th

for its younger population (ages 25 – 34)

10

21Slide23

6

Younger

Cohort

Falling

Behind

Global

Competition:

Where

We

Are

Now

Korea Canada Japan UK France

US

SOURCE: Country Data

-

Organisation for Economic

Co-operation

and

Development, Education

at a

Glance,

2016/

State Data

SCHEV staff

analysis

of

US Census

and

Lumina foundation

data

NOTE: State data represents

2014 while

country data shows

2015

data.

Massachusetts

Maryland

7

0%

6

0%

5

0%

4

0%

3

0%

2

0%

1

0%

0%

8

0%

Educational

Attainment

(Bachelor’s

and

Above

)

of

Virginia

and

Key

Competitors,

2015

Ages

25 to

34 Ages

25 to

64

Virginia

Prepared by the Council

on

Virginia’s Future,

2017

22Slide24

23

Source: American Community Survey, 2015 1-year Estimates, B15001.

Educational attainment rates vary by age.

35-44 year olds have the highest percentage of postsecondary degrees.

This could shift in the coming years as more individuals ages 25-34 earn a degree.

Graduate or professional degree

Bachelor’s

Associate

Some college

Virginia’s Educational Attainment

Rates by Age and Type

Virginia’s Educational Attainment by Age Group

23Slide25

Number of

High School

Graduates is

Relatively

Flat

24

Source:

Western

Interstate Commission for Higher Education, Knocking at the College Door: Projections of High School Graduates, 2016.

knocking.wiche.edu

* Total

is the sum of

Public School graduations and does

not include

Private School graduations,

which data was not available in a disaggregated form. A table that includes Private School totals is included in the appendix.

The

Public Schools Total will not exactly equal the sum of the races/ethnicities columns, which are projected separately.

Academic Year refers to the K-12 calendar running fall to spring and may include graduates from any point in that school year, including the summer after the year end. Slide26

Of 100 high school graduates in VA . . .

72 students in 2015 enrolled within 16 months at a:

4-year public,

4-year private, or

2-year institution

Little change in the percentage of HS graduates enrolling

Enrollment in postsecondary remained between 71-72% from 2008 to 2015

Source: Virginia Department of Education. Postsecondary

enrollment report

https

://p1pe.doe.virginia.gov/postsec_public/postsec.do?dowhat=LOAD_REPORT_C11

25Slide27

Percentage of 2015 HS Graduates Going to College

Source: Virginia Department of Education. Postsecondary

enrollment report

https

://p1pe.doe.virginia.gov/postsec_public/postsec.do?dowhat=LOAD_REPORT_C11

26Slide28

27

Division

Total

Students

Number Enrolled

Percent Enrolled

King and Queen

County

39

15

38%

Page

County

263

110

42%

Westmoreland

County

97

42

43%

Caroline

County

229

102

45%

Charles City

County

49

25

51%

Petersburg

City

172

89

52%

Staunton

City

171

89

52%

Appomattox

County

167

87

52%

Amelia

County

125

66

53%

Richmond

City

990

530

54%

School Divisions w/ Lowest Percent of HS Graduates Enrolled in CollegeSlide29

28

Division

Total

Students

Number Enrolled

Percent Enrolled

Fairfax County

12,048

10,111

84%

Prince William County

5,338

4,052

76%

Loudoun County

4,458

3,825

86%

Virginia Beach City

4,546

3,313

73%

Chesterfield County

4,165

2,984

72%

Henrico County

3,125

2,246

72%

Chesapeake City

2,767

2,106

76%

Stafford County

2,102

1,526

73%

Spotsylvania County

1,620

1,053

65%

Arlington

County

1,247

1,026

82%

School Divisions w/ Greatest Number of HS Graduates Attending CollegeSlide30

Trends by Race

29

HS Graduate College Enrollment

White/

2 or more races

Black

Hispanic

Source: Virginia Department of Education. Postsecondary

enrollment report

https

://p1pe.doe.virginia.gov/postsec_public/postsec.do?dowhat=LOAD_REPORT_C11

HispanicSlide31

Percent of Graduates Enrolling by Institution Type30

Where Did 2015 HS Graduates Go to

College

?

4-year public

4-year private

2-year

Source: Virginia Department of Education. Postsecondary

enrollment report

https

://p1pe.doe.virginia.gov/postsec_public/postsec.do?dowhat=LOAD_REPORT_C11 Slide32

Pell Undergraduate Enrollment Distribution 2016-1731

Source: All students http

://research.schev.edu//fair/pell_trend_report.aspSlide33

Pell Undergraduate Enrollment Trends32

Public 2-year

Public 4-year

Source:

http://research.schev.edu//fair/pell_trend_report.asp

Percent of Total Enrollments by Institution TypeSlide34

Virginia Plan Measure: SuccessSource: http://research.schev.edu/gradrates/success_index.asp

2011-12 for 4-year/2013-14 for 2-year within 100% time frame

Target: Annually improve completion rates that close the gap between underrepresented populations and traditional students by 2030

Note: Underrepresented populations include those who are minority race/ethnicity, students ages 25 and older, low-income or from areas of the state in the lowest quintile for postsecondary attainment. Completion is measured by the student success index which includes students who graduate or remain enrolled at any Virginia institution within the measurement timeframe.

The Student Success index is a broader measure than traditional graduation rates as it includes all students, including full-time, part-time, transfer and first-time in college students. In addition, success is counted by students who either graduate at their institution or another institution or remain enrolled after the measurement period.

Underrepresented populations

Non-underrepresented populations

Completion/Success Index for Public Institutions

33Slide35

Success Index Public 4-Year (Normal time)

34Slide36

Success Index Public 2-Year (Normal time)

35Slide37

6-year graduation rates by income are improving, but gaps remain largely the same

36

Source:

http://research.schev.edu//gradrates/CHL_EconTrendsHeac.aspSlide38

Attainment Rates in Rural VirginiaEducational attainment in the Commonwealth’s “rural horseshoe” lags the remainder of the state

If the rural horseshoe were its own state of nearly 2.1 million residents, it would be tied with Arkansas at 50th and ranked between Mississippi and West Virginia with only 19% of its residents holding a bachelor’s degree or higher – and 19% of adults fail to graduate high school

Nearly 1 in 3 adults are not in the workforce in Southside and Southwest Virginia

Source: Virginia Community Colleges, Rural Virginia Horseshoe Initiative

37Slide39

Individuals with Credits Earned and No Degree at a VA Public or Private, Nonprofit Institution38

Total

Individuals

Earning wages less than $44k

0-10 credits

318,808

257,315

11-29 credits

180,752

152,302

30-59 credits

101,861

87,643

60-89 credits

33,450

31,696

90+

13,039

12,301

Total Credits

647,910

541,257

Source: SCHEV research

Notes:

Credits--Virginians Enrolled in Public and Nonprofit Private Colleges between 1992-93 and 2012-2013 who Passed at Least One Class with a "D" or Better.

Earnings—Earnings are based on years 2011, 2012, 2013, 2014, or 2015Slide40

39Virginia Plan Measure: Awards

Target: Grant 1.5 million undergraduate degrees and workforce credentials by 2030, including those that close the gap in unfilled jobs

Source: Commonwealth Degree, Certificate Completion Scorecard

http://research.schev.edu/completions/completion_scorecard.asp

Actual and Projected Cumulative Awards to reach 1.5 million Target by 2030

Projections

ActualsSlide41

StrategyLabs.LuminaFoundation.org40

Strategy LabsSlide42

Virginia Attainment Rates by County and Independent City

41

Source: Lumina FoundationSlide43

Virginia Attainment Rates by County and Independent City

42

Source: Lumina FoundationSlide44

Virginia High School Graduations

43

Source:

www.knocking.wiche.edu

Slide45

Virginia High School Graduations

44

Source:

www.knocking.wiche.edu