/
Results: Results:

Results: - PowerPoint Presentation

celsa-spraggs
celsa-spraggs . @celsa-spraggs
Follow
402 views
Uploaded On 2016-07-26

Results: - PPT Presentation

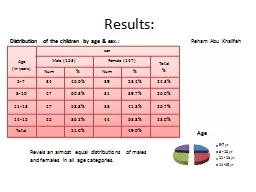
Age In years sex Male 153 Female 147 Total Num Num 57 34 466 39 534 243 810 47 603 31 397 260 1113 47 588 33 413 267 1415 25 362 44 ID: 420378

income results distribution healthy results income healthy distribution behaviours amp family child females sick obesity case males allergic 100

Share:

Link:

Embed:

Download Presentation from below link

Download Presentation The PPT/PDF document "Results:" is the property of its rightful owner. Permission is granted to download and print the materials on this web site for personal, non-commercial use only, and to display it on your personal computer provided you do not modify the materials and that you retain all copyright notices contained in the materials. By downloading content from our website, you accept the terms of this agreement.


Presentation Transcript

Slide1

Results:

Age (In years)sexMale (153)Female (147)Total%Num%Num%5-73446.6%3953.4%24.3%8-104760.3%3139.7%26.0%11-134758.8%3341.3%26.7%14-152536.2%4463.8%23.0%Total51.0%49.0%

Distribution of the children by age & sex.:

Reham Abu Khalifeh

Revels an almost equal distributions of males and females in all age categories. Slide2

Results:

Distribution of the Domestic animals : Ayad Al-hadi None92.3%Animal inside .3%Animal Outside 4%Birds inside .3%Birds Outside 3%Slide3

Results:

Osama DreawishDistribution of House ownership 45%32%9%7%4.7%1%1%Slide4

Results:

#%none279.0government13745.7armed forces11237.3other248.0Type of health insurance Ameer AbarahSlide5

Results:

Basel Al Hakami. Distribution of number of persons sleeping in the same room: Most commonly 2-3 persons sheared a room together. Average number of persons Sleeping in the same room%19.3%249.7%324%410.7%55%6.7%

7

.7%Slide6

Results:

Musab al OmariHealthy behaviours Healthy behaviours#%NO 6923.0Yes23177.0In Healthy behaviours: We asked about if the watch for their personal hygiene and washed their hands, cut their nails, and brushed their teethes on regular basis. Slide7

Results:

Muhamd ben MustafaHealthy behavioursNoYesless than 10033.3%66.7%100-19935.7%64.3%200-29919.0%81.0%300-49924.8%75.2%500-99922.9%77.1%more than 100011.1%88.9%Healthy behaviours & Family Income P-value = 0.03Slide8

Results:

Distribution Of Children Did exercise & relation to Gender Chi-Square TestsValuedfAsymp. Sig. (2-sided)Pearson Chi-Square27.757a2.000Likelihood Ratio28.8322.000Linear-by-Linear Association

27.650

1

.000

N of Valid Cases

300

a. 0 cells (.0%) have expected count less than 5. The minimum expected count is 22.54.

Adam

Abd

Jamea’h

exercise

sex

male

female

NONE

11

35

23.9%

76.1%

Occasionally

78

85

47.9%

52.1%

Regularly

64

27

70.3%

29.7%

% of males : females in the same category Slide9

Results:

Haitham al NasserIn case the child become sick, you usaully consultFrequencyPercentPHC17658.7private doctor4214.0government hospital3913.0private hospital62.0use home remedies299.7alternative medicine82.7Slide10

Results:

family income per month in JDIn case the child become sick, you usually consultPHCprivate doctorgovernment hospitalprivate hospitalless than 10033.3%66.7%100-19978.6%200-29961.9%4.8%23.8%300-49956.2%18.2%19.7%500-99969.8%8.3%3.1%6.3%more than 100020.6%25.9%9%P-value : .001In case the child become sick consult And it’s relation to Family income:

Abdlarhman

ZarzorSlide11

Results:

Meta’ab al otaibypresence of chronic disease(s) at time of visit FrequencyPercentno26287.3congenital1.3allergic rhinitis134.3asthma31.0metabolic2.7obesity196.3Slide12

Results:

% within Incidence of chronic diseases during last monthIncidence of chronic diseases during last monthsexmalefemaleno50.4%49.6%congenital50.0%50.0%allergic rhinitis100.0%asthma100.0%metabolic100.0%obesity62.5%37.5%P-Value = 0.02Males Are more affected by Asthma and Metabolic diseases While Females are more Affected by Allergic Rhinitis Mohamd ThyabatSlide13

Results:

Ramzi DaghririFrequencyPercentno27290.7congenital2.7allergic rhinitis41.3asthma31.0metabolic2.7obesity165.3tumors1.3Slide14

Results:

Turki al-Khaldi less than 100100-199200-299300-499500-999more than 1000Not Obese100.0%100.0%95.2%98.5%

90.6%

74.1%

Obese

.0%

.0%

4.8%

1.5%

9.4%

25.9%

Family income & Obesity:

There was a significant Increase in Obesity number in families with higher income

(P-value: .001)