PPT-This Analysis Looks At TV Spend & Corresponding Financi
Author : celsa-spraggs | Published Date : 2016-08-15
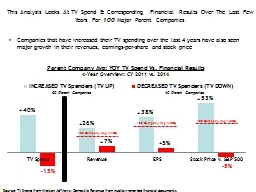
100 Major Parent Companies Parent Company Avg YOY TV Spend Vs Financial Results 4Year Overview CY 2011 vs 2014 Companies that have increased their TV spending
Presentation Embed Code
Download Presentation
Download Presentation The PPT/PDF document "This Analysis Looks At TV Spend & Co..." is the property of its rightful owner. Permission is granted to download and print the materials on this website for personal, non-commercial use only, and to display it on your personal computer provided you do not modify the materials and that you retain all copyright notices contained in the materials. By downloading content from our website, you accept the terms of this agreement.
This Analysis Looks At TV Spend & Corresponding Financi: Transcript
Download Rules Of Document
"This Analysis Looks At TV Spend & Corresponding Financi"The content belongs to its owner. You may download and print it for personal use, without modification, and keep all copyright notices. By downloading, you agree to these terms.
Related Documents