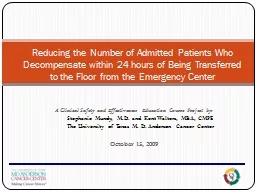
Stephanie Mundy MD and Kent Walters MBA CMPE The University of Texas M D Anderson Cancer Center October 15 2009 Reducing the Number of Admitted Patients Who Decompensate within 24 hours of Being Transferred to the Floor from the Emergency Center ID: 668516
Download Presentation The PPT/PDF document "A Clinical Safety and Effectiveness Educ..." is the property of its rightful owner. Permission is granted to download and print the materials on this web site for personal, non-commercial use only, and to display it on your personal computer provided you do not modify the materials and that you retain all copyright notices contained in the materials. By downloading content from our website, you accept the terms of this agreement.
Slide1
A Clinical Safety and Effectiveness Education Course Project by:Stephanie Mundy, M.D. and Kent Walters, MBA, CMPEThe University of Texas M. D. Anderson Cancer CenterOctober 15, 2009
Reducing the Number of Admitted Patients Who Decompensate within 24 hours of Being Transferred to the Floor from the Emergency CenterSlide2
Rationale – Resource Utilization, Improve Patient Care2There is a need to improve how patient acuity is assessed in order to optimize our patient care resourcesTo improve patient care by reducing number of patients who decompensate and are transferred to ICU within 24 hours of admission to floor from the Emergency Center
Decompensate = patient had cardiopulmonary arrest or severe decline in physical status requiring emergent attention of the medical staffTo optimize utilization of nursing unit, telemetry, and ICU beds through improved assessment of patient acuity prior to transfer from the Emergency Center
Based on limited bed resources (physical space and staffing) for all units identified aboveSlide3
Rationale – Problem Confirmation3During the period January 2006 through mid-November 2006 there were 94 patients who transferred from the floor to the ICU in less than 24 hours from admission from the Emergency Center or 1.45% of total admissions from the Emergency CenterAll patients transferred to the ICU were included, consisting of postoperative patients, patients transferred for a procedure or careful monitoring as well as those
truly decompensatedSlide4
Rationale – Research 4“Nearly 85% of inpatients that had cardiac arrest showed identifiable signs of deterioration during the previous eight hours. Recognition of these signs and timely intervention may reduce morbidity and mortality”.
Source: Bristow PJ, Hillman KM, Chey T, Daffurn K, Jacques TC, Norman SL, Bishop GF, Simmons EG: Rates of in-hospital arrests, deaths and intensive care admissions: The Effects of a Medical Emergency Team, MJA 2000;173:236-240.Slide5
Background5The Emergency Center admits 35% of all hospital admissions at UTMDACC, which approximates 656 patients per monthEmergency Center patient acuity is significantly higher than a non-cancer specific emergency center:Facility
% of Patients Admitted from EC
% of Admissions to
ICU
UT M. D. Anderson Cancer Center
35.0
% 7.0
%
Non-cancer Hospital 13.9
%
1.3
%
(1)
(1) Source: National Ambulatory Care Survey: 2003 Emergency Department Summary. Advance Data. Number 358. May 26, 2005. U.S. Department of Health and Human Services,
CDC.Slide6
Background6Project is first step in developing acute care scoring system for all patientsEC selected as pilot area given 35% of inpatient admissions originate from the EC; andEC inpatient admissions represent a higher acuity patient population with a greater chance of decompensating within 24 hours of being admitted to the floor.Slide7
Aim Statement7Decrease by 25%, the decompensation rate (transfers to the ICU within 24h) for patients admitted to the floor from the Emergency Center, within 12 months. Slide8
Aim Statement
Reducing
the Number of Admitted Patients
Who
Decompensate within 24 hours of Being
Transferred
to the Floor from the EC
Business
Administration
Quality
Improvement
Pharmacy
Nursing
Physician
Clinical
Informatics
Information
Systems
Multidisciplinary Team ApproachSlide9
Ishikawa Analysis9Ishikawa analyzed for commonality in process areas to determine an area of concern as viewed by all health care providers that contribute to patient decompensatingIshikawa processes were identified by physician, nursing, clerical, pharmacy, and business staff members through distribution of cause and effect
diagram and focus groupsEach process then ranked (1 to 5, high to low) by each individual relative to chief concernsSlide10
Ishikawa (Fishbone) Diagram10Slide11
Ishikawa Analysis11Slide12
Ishikawa Analysis12Sorted Histogram of Top Reasons for Patients Decompensating within 24 hours of Admission to Floor from the ECSlide13
What We Uncovered13
Waste in how vital signs are documentedHandwritten on EC noteEntered into ClinicStation
Entered into WhiteboardLikely need for improved ICU bed resource and utilization
Improved training needed on vital sign monitoring
Root cause analysis of why certain units have higher
decompensation
rate than others
Pandora by John William Waterhouse, 1896
13Slide14
Intervention Options14The cause and effect analysis resulted in intervention options:All patients reevaluated by MD prior to transferAll patients reevaluated by RN prior to transferComplex scoring system utilizing vital signs, comorbidities, type of cancer, labs etc. – too time consuming
ClinicStation be modified to signal (red flashing) when vital signs trends are abnormal – not feasible at current timeVital signs to be taken every 2 hours with split of CNA every 4 hours and RN every 4 hours and placed into ClinicStation –
creative staffing solution!Vital signs linked from bedside monitor to ClinicStation – technically possible financially notSlide15
Selected Intervention15Criteria for selection was ease of implementation (people, process, and technology) relative to direct and indirect costsBased on criteria and testing of options it was discovered ClinicStation could print a vital sign trend in graph and table formatSlide16
Intervention Implementation16Current Process Mapping Slide17
Intervention Implementation17Slide18
Intervention Implementation18Slide19
Intervention Implementation19Intervention implementation required using the Plan Do Check Act (PDCA) methodologyA process diagram was developed based on the perceived new work flow for reviewing vital sign trendsProcess flow charts posted in the EC and distributed to EC physicians, RNs, and CNAFollow-up written and verbal communication occurredSlide20
Selected Intervention20
Table Format
Vital Sign Review in action
2 keystrokes total – review and print. Meets process and technology objectives.
Graph FormatSlide21
Data Collection21Data was collected at 3 pointsInitial period of 11/17/06 to 11/30/06 and 12/1/06 to 12/31/06, and 01/1/06 to 04/30/09First data collection period saw no change in percent of patients who decompensateThough analysis determined sample too small to draw any conclusions as to effectiveness of interventionSlide22
Baseline Data22
Baseline
VS EC P
Jan 06
Feb 06
Mar 06
Apr 06
May 06
Jun 06
Jul 06
Aug 06
Sep 06
Oct 06
NovA 06
NovB 06
# EC-Fl-ICU w/in 24 hr pts/ # EC adm pts
0
1
3
4
5
UCL=3.18
CL=2.30
Percent of EC Admissions - 'EC-Floor-ICU within 24 Hours'
11 month
decompensation
rate =
1.45%Slide23
Data Collection – 2nd Point23
Intervention 11/17/06
2.28% to 1.89% decompensation rateSlide24
Data Collection – Comparison by Baseline, New EC, and EC Pod A24
New average of 0.7% for a 47.5% change since project inceptionSlide25
Intervention Results25Solid improvement achieved during second data collection period compared to first data collection periodDuring the project period there was 33% compliance with the vital sign summary analysis, and only 33% of those patients transferred to the ICU during both periods had the vital sign data complete with indication of reviewImportant to note data was more inclusive than exclusive during first round of baseline data
collectionSlide26
Obstacles Encountered26Slide27
Obstacles Encountered27Throughout the intervention process several obstacles encountered:Compliance with printing and signing vital sign trend graphHigh EC volume that contributed to reduced compliance on certain days
Inconsistency in using ClinicStation for vital sign entryCompeting CS&E projects as well as other quality improvement initiatives – information overload e.g. remembering what to do when and for whomSlide28
Obstacles - Communication28Slide29
Obstacles Encountered – Compliance Rate29
Compliance PercentSlide30
How Obstacles Were Addressed30Communicate, Communicate, Communicate!Constant communication (direct and indirect) increased compliance rates significantlyCompliance rate improved when Dr. Mundy was working in the EC!Slide31
ROI Analysis – Cost Basis31Average Cost per Day (H&C Only) and ALOS for Intensive Care Units
January 2008 - December 2008 Admissions
Medical ICU ALOS* 5.91
Medical ICU
Avg
Charge/Day $ 15,081
Medical ICU
Avg
Cost/Day $ 7,267
Pedi ICU ALOS* 4.92
Pedi ICU
Avg
Charge/Day $ 16,284
Pedi ICU
Avg
Cost/Day $ 7,877
Overall ICU
Avg
Cost Day $ 8,224 Slide32
ROI Analysis – Cost Avoidance32The project has significant impact on cost avoidance. Avoided costs included ICU charges not reimbursed due to payor (especially governmental).In a DRG environment, this is key and critical.
The average ICU admission charge (bed, drugs, therapies, imaging) can average ~ $15,081 per day.The average ICU cost per day is $7,267.Reducing ICU bed days (especially in a DRG environment) by 47% results in an annual savings of ~$ 4,360,200.00
(600 ICU bed days avoided multiplied by $7,267).Slide33
ROI Analysis – Changes to Whiteboard and ClinicStation33Process of charting vitals directly into ClinicStation eliminates need for paper based progress notes. Productivity gains based on time involved in using paper based systems and then re-transcribing into ClinicStation.
Other BenefitsImproved patient safety by reducing transposition errorsIncreased nursing time with patient instead of paperwork
Compliance in entering vitals into ClinicStationDecrease in patient to physician time, and
Significant morale booster
!Slide34
Overall Conclusions34SustainabilityMonthly review of patient decompensating data to be presented by 3rd Thursday of month at EC Management meetingImprovements to be made include adding time reviewed with signature on medical record form (time stamp in ClinicStation
now eliminates this step)Institutional LearningImproved understanding of how clinical processes should leverage technology to improve patient safety and maintain true patient centered care.Slide35
UT System and
UT M. D. Anderson Cancer Center Executive Leadership for the opportunity
35
Pandora’s Box
Thank you
!