/
Dietary Pattern and Lifestyle Factors Associated with Menopausal Symptoms Dietary Pattern and Lifestyle Factors Associated with Menopausal Symptoms

Dietary Pattern and Lifestyle Factors Associated with Menopausal Symptoms - PowerPoint Presentation

cheryl-pisano
cheryl-pisano . @cheryl-pisano
Follow
344 views
Uploaded On 2019-12-05

Dietary Pattern and Lifestyle Factors Associated with Menopausal Symptoms - PPT Presentation

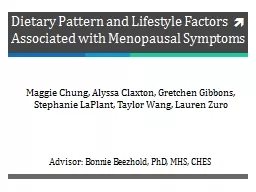
Dietary Pattern and Lifestyle Factors Associated with Menopausal Symptoms Maggie Chung Alyssa Claxton Gretchen Gibbons Stephanie LaPlant Taylor Wang Lauren Zuro Advisor Bonnie Beezhold PhD MHS CHES ID: 769198

menopausal symptoms day intake symptoms menopausal intake day physical diet eat sweets mental ratio results foods means 001 groups

Share:

Link:

Embed:

Download Presentation from below link

Download Presentation The PPT/PDF document "Dietary Pattern and Lifestyle Factors As..." is the property of its rightful owner. Permission is granted to download and print the materials on this web site for personal, non-commercial use only, and to display it on your personal computer provided you do not modify the materials and that you retain all copyright notices contained in the materials. By downloading content from our website, you accept the terms of this agreement.


Presentation Transcript

Dietary Pattern and Lifestyle Factors Associated with Menopausal Symptoms Maggie Chung, Alyssa Claxton, Gretchen Gibbons, Stephanie LaPlant, Taylor Wang, Lauren Zuro Advisor: Bonnie Beezhold, PhD, MHS, CHES

Introduction Research Question Do women on a plant-based diet have fewer menopausal symptoms? Are there other lifestyle factors that also impact menopause?HypothesisWomen who are vegetarians or vegans will report fewer symptoms compared to those who are omnivores. (Beezhold, Radnitz, Rinne, DiMatteo, 2015) 1

Overview - Menopause Menopause overviewMenopause symptomsHormone replacement therapy (Grant 20152 , Opatrny 2008 3, Shumaker 20034 )

Overview-Research Studies Fewer menopausal symptoms associated with higher intake of whole grains, F&V in Chinese postmenopausal women. 5Decreased menopausal symptoms associated with high fiber intake in women treated for breast cancer. 6 Plant-based diets are associated with favorable metabolic profiles in pre- and post-menopausal women. 7 Vegan diet was associated with reduced HDL-C level in pre- and post-menopausal women. 8 5. Liu, 2015; 6. Gold, 2006; 7. Karelis, 2010; 8. Yee-Wen, 2014

Study Objectives To investigate whether dietary patterns and behaviors as well as specific foods were associated with symptoms that occur during menopause in aging women.To investigate whether demographic and lifestyle factors were related to menopausal symptoms.

Methods – Study Design Cross sectional survey study Online delivery through convenience sampling using SurveyMonkeyEligibility requirementsFemales, ages 45-80 years oldWilling to complete an online survey

Methods – Participant Recruitment

Methods – Survey Survey completionSurvey componentsDemographicsLifestyle factors

Methods – Survey Frequent urinationInvoluntary urination when laughing or coughing Change in sexual desire Flatulence or gas pains Aching in muscles and joints Feeling tired or worn out Difficulty sleeping Aches in back of neck or head Decrease in physical strength Decrease in stamina Vaginal dryness during intercourse Avoiding intimacy Hot flashes Night sweats Sweating Being dissatisfied with personal life Feeling anxious or nervous Poor memory Accomplishing less Feeling depressed, down, or blue Being impatient with others Feelings of wanting to be alone Increased facial hair Changes in skin Feeling bloated Backaches Severity of menopausal symptoms; Menopause-Specific Quality of Life questionnaire (MENQOL)

Methods – Survey Which of the following foods do you include in your diet (at least monthly)?Meat (beef, pork, lamb); chicken or turkey; fish or shellfish; eggs; dairy foods; noneDiet questions: foods, food groups, nutrientsFruits, vegetables, beverages, omega-3 fatty acids

Methods – Survey FRUITS AND VEGETABLES Never or less than 1X a mo (1) 1-3X Per Mo (2)  Once A Wk (3)  2-4X Per Wk (4)  5-6X per Wk (5) Once a Day (6) 2-3X per day (7) 4-5X per day (8) 6+X per day (9) Apricots, plum, pear, apple                   Berries (any type)                   Citrus fruits (oranges, grapefruit, tangerines)                   Grapes                   Pineapple, papaya, mango (fresh)                   Broccoli, Brussels sprouts, cauliflower, kale, mustard greens, radish, turnips                   Orange vegetables (carrots, sweet potatoes, butternut squash, pumpkin)                   Spinach, Swiss chard, salad greens                  

Survey Validity & Reliability ValidityIncorporated validated scales Exercise and social supportMenopause-specific Quality of Life questionnaire (MENQOL) Use of clear and appropriate language for survey questions Pilot testing and feedback Online delivery promoted large geographic sample. Reliability Potentially unclear questions were eliminated Validated scales showed strong internal consistency and test-retest reliability MENQOL – Cronbach alpha coefficient = 0.93 (0.81 to 0.89)

Methods - Statistical analysis Correlational, differential analysisParametric statisticsDescriptive statisticsPearson’s correlation coefficients and multiple linear regression; Chi square testsIndependent t tests, ANOVA, ANCOVA Significance - p < .05; SPSS version 23

Results

Menstrual Status Postmenopausa l 77.8% n=383 Peri - menopausal 22.2% n =109

Diet Pattern OMN55.7% n=248 VG 27.6% n=123 VEG 16.6% n=74 Vegetarian Types Semi-vegetarian Pescatarian Ovo -vegetarian Ovo -lacto-vegetarian Lactovegetarian

Canada 4.0 %n=18 Other 4.3 % n =19 United States 91.7% n = 408 Location by Country

Other 4.0% n=18Ethnicity White 89.4% n =398 Hispanic 3.1 % n = 14 Black 1.3% n=6 Asian 2.0% n=9

Normal 43.9% n =168 Overweight 23.0% n =88 Obese 33.2% n =127 Body Mass Index (BMI)

Education

Variables nOMN n=248 VEG n=74 VG n =123 Test stat p value Mean ± SD Mean ± SD Mean ± SD Age 445 59.17 ± 7.85 a 58.35 ± 7.57 b 55.15 ± 6.29 ab F =12.28 <0.001 Country (US/non-US)445243 / 5ab69 / 5a96 / 27bX2=57.94 <0.001Ethnicity (white/other)445227 / 21 65 / 9 106 / 17 X 2 = 2.73 0.255 Education ( yrs beyond HS) 445 7.46 ± 3.63 8.03 ± 3.77 6.96 ± 3.39 F =2.09 0.125 BMI 395 29.02 ± 7.12 ab 25.89 ± 5.77 b 26.54 ± 6.32 a F =8.23 <0.001 Same letters differ significantly Population Characteristics by Diet Type

Principle component analysis results: Component 1: Physical symptoms (17) Component 2: Mental symptoms (6) Menopausal Symptoms

Associations of Diet Type with Symptoms Variables N Physical symptoms Mental symptoms r / p value r / p value Diet type ( Omn /Vg) 371 -0.122 / 0.01 0 0.057 / 0.233 Total vegetable s 432 -0.181 /<0.001 -0.14 2 / 0.003 Total fruits 431 -0. 099 / 0.040-0.100 / 0.039Total flesh foods431 0.173 /<0.001-0.033 / 0.490Beef 422 0.157 / 0.001 0.009 / 0.858Total dairy foods430 0.196 /<0.001 0.071 / 0.141Total eggs431 0.115 / 0.018-0.043 / 0.378Pearson’s correlation coefficients; p<.05 is significant

Multivariate Analysis – Predictors of Menopausal Symptoms PHYSICAL symptoms MENTAL symptoms Variable β * p value Variable β* p value Age -0.234 <0.001 Social support -0.246 <0.001 Vegan diet (N/Y) -0.181 0.002 Age -0.201 <0.001 BMI 0.157 0.004 Berries intake freq -0.128 0.009 Sleep hrs /night -0.106 0.040 Sweets intake freq 0.117 0.015 Sweets intake freq 0.103 0.057 Sleep hrs /night - 0.096 0.046 Total exercise -0.088 0.107 Total exercise -0.086 0.090 BMI 0.083 0.097 R 2 0.158 R 2 0.187 Correlates with p values < .025 included in models. *Betas are standardized.

Comparison of Symptoms by Diet Groups Symptomsn OMN n =248VEG n=74 VG n=123 F ratio Adj F ratio Mean ±SD Mean ±SD Mean ±SD Physical symptoms 445 40.46 ± 17.83 a 41.12 ± 17.78 b 33.26 ± 14.80 ab 8.33 * * 12.83 ** 1 Mental symptoms 445 13.64 ± 6.32 15.35 ± 7.97 13.87 ± 7.27 1.78 3.52 *2 ** p <0.001, * p <0.05; ANOVA - s ame letters differ significantly. 1 ANCOVA adj means: 41.62 a , 40.63 b , 31.83 ab , p ƞ 2 = 0.062. 2 ANCOVA adj means: 14.12, 15.40 b , 12.87 b , p ƞ 2 =0.016.

Vegan diet is associated with lower severity of physical menopausal symptoms; vegans reported lower symptom severity than those who ate animal foods. Confirmed previously mentioned studies. 9,10Vegan diet had highest dietary fiber intake vs omnivorous diet. 11,12 9. Liu, 2015; 10. Gold, 2006; 11. Bani , 2013; 12. Park, 2011 . Discussion

Sweets intake Excess sugar consumption is linked to cell aging, negative health ailments 13-15 Excess sugar consumption 13 is linked to deficiencies in memory, cognitive health, and affects biological aging 16,17 13. World Health Organization, 2015; 14. Melton, 2000; 15. Mikulikova et al 2008; 16. Crane et al 2013; 17. Cassidy et al 2010

NIH Dietary Questionnaire II We are interested in whether you consume any of the following specific foods or beverages and how frequently you do so.   ON AVERAGE OVER THE PAST YEAR   Never or less than once a month (1)   1-3 per month (2)   Once a week(3)   2-4 per week (4)     5-6 per week (5)   Once a day (6)   2-3 per day (7)   4-5 per day (8)   6+ per day (9) Sweets (pastries, cakes, cookies, brownies, candy, etc.)                   Soft drinks (sugar-sweetened, non-diet)                   Methods

Variable n OMN VEG VG p value* Mean ± SD Mean ± SD Mean ± SD Sweets 432 3.84 ± 1.81 a 3.44 ± 1.87 b 2.64 ± 1.52 ab < .001 1 Soda 424 1.61 ± 1.28 a 1.25 ± 0.89 b 1.13 ± 0.55 ab < .001 2 * ANOVA; groups with same letters differed significantly. 1 F = 18.8, p ƞ 2 = .08. 2 F = 8.8, p ƞ 2 = .04. Results – Intake of Sweets / Soda

Variables nPhysical symptoms(r/ p ) Mental symptoms( r / p ) Sweets intake 432 .167 / .001 .130 / .007 Soda intake 424 .118 / .015 .102 / .035 Total sweets intake frequency 423 .179 / .001 .139 / .004 Results – Associations Pearson’s correlation coefficients; p<.05 is significant.

Results – Group Comparison Total sweets variablen Never or rarely eat sweets Less frequently eat sweets More frequently eat sweets F ratio Adj F ratio M ± SD M ± SD M ± SD Physical Symptoms 377 37.77 ± 17.55 a 35.53 ± 13.98 b 45.46 ±20.47ab11.33*8.82*1Mental Symptoms42313.73 ±7.11a13.06 ±5.99b16.38 ±7.63ab 8.07* 7.21* 2 * p < . 01; s ame letters differ significantly . 1 Adj means: 36.37, 35.64, 44.51, p ƞ 2 = 0.045. 2 Adj means: 13.63, 13.26, 16.17, p ƞ 2 = 0.033

Eating sweets was related to increased severity of menopausal symptoms; females eating sweets more frequently had higher symptom severity than those who never or rarely ate sweets. Intake of sweets was positively associated with the risk of onset of menopausal symptoms18,19 Frequency of sweets intake was associated with chills 20 Discussion 18. Sabia et al 2008; 19. Herber-Gast & Mishra, 2013; 20. Ishizuka, 2008

Background – Berry Intake Foods that contain phytoestrogens act as antioxidants which may relieve menopausal symptoms 21Higher intake of flavonoids at midlife is associated with greater wellbeing in the elderly 22 21. Moreira et al, 2014; 22. Samieri et al, 2014

We are interested in whether you consume any of the following specific foods or beverages and how frequently you do so.   ON AVERAGE OVER THE PAST YEAR   Never or less than once a month (1)   1-3 per month (2)   Once a week (3)   2-4 per week (4)     5-6 per week (5)   Once a day (6)   2-3 per day (7)   4-5 per day (8)   6+ per day (9) Berries (any)                   Methods

Variable nOMNVEGVG p value Mean ± SD Mean ± SD Mean ± SD Berry intake frequency 419 3.72 + 1.65 a 3.86 + 1.66 b 4.54 + 1.87 ab <.001* Results – Intake of Berries * ANOVA, F ratio = 9.036 , p ƞ 2 = 0.042; groups with same letters differed significantly.

Results – Associations VariablesnPhysical Symptoms ( r/p) Mental Symptoms ( r/p ) Berry intake frequency 119 - .208 / .000 - .188 / .000 Pearson’s correlation coefficients; p<.05 is significant.

Results – Comparison of Groups * p < .05; groups with same letters differ significantly. 1 ANCOVA adj means: 43.41, 38.41, 36.61, p ƞ 2 = 0.02 2 ANCOVA adj means: 15.76, 13.88, 12.87, p ƞ 2 = 0.02 Never or rarely eat berries Eat berries weekly Eat berriesdailyF ratio Adj F ratio nM ± SDM ± SDM ± SDPhysical Symptoms37344.84 ±21.26a38.38 ±15.8335.14 ± 15.56 a 7.39* 3.78* 1 Mental Symptoms 420 16.15 ± 7.85 a 13.80 ± 6.73 12.64 ± 5.97 a 6.72* 4.93* 2

Discussion Eating berries was related to decreased menopausal symptoms; females eating berries daily had lower symptoms than those never or rarely eating berries.Decrease in estrogen during menopause increases oxidative stress 23,24 Berry supplementation resulted in significant improvement in symptoms 25 23. Manach et al, 2004; 24. Doshi et al, 2013; 25. Schrager et al, 2015

Omega-3 fat26 supplementation decreased depression symptoms and hot flash frequency 27 Background – Omega-3 Fats Plant Based Animal Based 26. Mozaffarian et. al, 2011; 27. Freeman et. al, 2011

Methods NIH Dietary Questionnaire II format; Omega-3 questionnaire (Sublette et al, 2011) We are interested in whether you consume any of the following specific foods or beverages and how frequently you do so.   ON AVERAGE OVER THE PAST YEAR   Never or less than once a month (1)   1-3 per month (2)   Once a week (3)   2-4 per week (4)     5-6 per week (5)   Once a day (6)   2-3 per day (7)   4-5 per day (8)   6+ per day (9) Walnuts or walnut oil, canola oil                   Flaxseeds (ground) or flaxseed oil

Variable OMNVEG VG p value M ± SD M ± SD M ± SD Walnuts, canola oil 2.53 ± 1.55 ( n =238 ) 3.04 ± 1.78 ( n =71) 3.11 ± 1.86 ( n =116) .003 1 Flaxseed, flaxseed o il 1.92 ± 1.58 ( n =239)2.51 ± 1.80(n=73)3.44 ± 2.01(n=117)<.00121ANOVA, F ratio = 5.86, ƞ2= 0.027; 2 ANOVA, F ratio = 29.56, ƞ 2 = 0.122 Results: Comparison of Groups

Frequency of major ALA sources n Physical Symptoms(r/p) Mental Symptoms ( r /p)Walnuts 426 - .066 / .172 - .096 / .048 Flaxseeds 430 - .127 / .008 - .088 / .068 Total major ALA sources 424 - .132 / .007 - .120 / .014 Results: Associations with Symptoms Pearson’s correlation coefficients; p<.05 is significant.

n Never or rare freq of major ALA Less freq of major ALA More freq of major ALA F ratio Adj F ratio M ± SD M ± SD M ± SD Physical Symptoms 424 40.37 ± 18.16 a 39.57 ± 17.46 35.40 ± 15.87 a 3.21* 1.56 Mental Symptoms 424 14.95 ± 7.25 a 14.13 ± 7.08 12.63 ± 6.18 a 3.96* 3.47* 1 * p < . 05; groups with s ame letters differ significantly . 1 ANCOVA adj means: 14.94, 13.94, 12.86:, p ƞ 2 = .016. Results: Comparisons of Groups

Discussion Eating major ALA sources was associated with decreased menopausal symptoms; those who ate them more frequently vs never or rarely reported less mental symptom severity.Vegetarians reported better mood and higher PUFA than omnivores 28High ALA intake in vegetarians lowers the LA/ALA ratio 29 28. Beezhold et. al 2010; 29. Sanders 2009

Background Diets rich in monounsaturated fatty acids improved the quality of life for postmenopausal women.30Fast food consumption, starting in adolescents, among those following a Western diet have a stronger association with overweight/obesity, and poor dietary outcomes.31 30. Anderson-Vasquez et. al, 2015; 31. Poti et. al, 2014

Methods Which of the following best describes the type of meals you most frequently eat? .   ON AVERAGE OVER THE PAST YEAR   Never or rarely 2-4 times per month 2-3 times per week 4-6 times per week   Once per day 2-3 times per day Convenience/Frozen Food             Home Cooked Meals Eat out (fast food) Eat at a full service restaurant

Eating habits OMN VEG VG p value* Eat home-cook meals 241 (n=243) 71 (n=71) 121 (n=122) .745 Eat convenience foods 105 (n=240) 23 (n=72) 46 (n=115) .199 Eat fast foods 139 (n=240) 29 (n=72) 27 (n=117) .000 1 Eat at full service restaurants 213 (n=245) 58 (n=72) 82 (n=121) .002 2 Results – Comparison of Groups *Chi-square; p <.05 is significant. 1 X 2 (10, N = 429)= 44.06. 2 X 2 (8, N = 438)= 24.41.

Results – Associations of Eating Patterns Eating behavior patternsn Physical symptoms ( r/p ) Mental symptoms ( r/p ) Eat home-cooked food 437 -.041 / .387 - .017 / .729 Eat convenience/ frozen food 428 .127 / .009 .102 / .035 Eat fast food 430 .179 / .000 .132 / .006 Eat at full-service restaurants 439 -.004 / .932- .120 / .012Pearson’s correlation coefficients; p<.05 is significant.

Results – Comparison of Groups nNever engaging in eating pattern M ± SD Engaging in eating pattern M ± SD t statistic F ratio ANCOVA Physical Symptoms 379 37.03 ± 16.44 41.77 ± 18.57 -2.95* 2.92 Mental Symptoms 428 13.44 ± 6.92 14.87 ± 6.78 -2.29* 2.14 Physical Symptoms 383 35.85 ± 16.4943.31± 18.11-4.11* 8.15**1Mental Symptoms43013.24 ± 6.53 15.08 ± 7.32 -2.91* 7.35** 2 Independent t test; p < .05; ** p < .01; groups with s ame letters differ significantly. 1 ANCOVA adj means: 36.95, 41.97, p ƞ 2 =0.045. 2 ANCOVA adj means: 13.30, 15.01, p ƞ 2 =0.017. Conv Foods Fast Foods

Discussion Eating convenience or fast food is related to an increased severity of menopausal symptoms, and those who consumed fast foods reported more severe symptoms than those who did not.Those who ate fast food had less healthy dietary intake overall32Older women who did not eat fast foods reported fewer and less severe symptoms33 Fast food frequency by women were lower in vitamin A, carotenes and vitamin C density 34 32. Wilcox et al, 2013; 33. Moore et al, 2009; 34. Bowman, 2004

Background- Physical Activity Regular aerobic exercise is associated with improved menopause symptoms, including anxiety and depression 35Physically inactive menopausal women have more depressed mood, memory/ concentration problems, vasomotor symptoms than physically active women 36 35. Luoto et. al, 2012; 36. Mansikkamaki et. al, 2015

“Considering a 7-day period, how many times on average do you do the following kinds of EXERCISE for more than 15 minutes during your free time?” (Responses 0-20x/week) Total exercise: (Mild X 3) + (Mod X 5) + ( Stren X 9) Methods

OMN n=248VEGn=151 VG n=123 p value Means ± SD Means ± SD Means ± SD Mild 4.88 ± 3.13 5.22 ± 3.30 5.41 ± 3.54 0.314 Moderate 3.10 ± 2.36 3.35 ± 2.42 3.67 ± 2.86 0.127 Strenuous 1.61 ± 1.31 a 2.28 ± 1.84 1.92 ± 1.71 a 0.003 1 Total 45.11 ± 22.98a 55.04 ± 28.36 49.68 ± 25.51 a 0.002 2 ANOVA test; groups with s ame letters differ significantly . 1 F ratio= 6.3, ƞ 2 = 0.18 . 2 F ratio= 6.5, ƞ 2 = 0.28 Results – Comparison of Groups

Results - Associations with Symptoms Variable N Physical Symptoms Mental Symptoms r/p value r/p value Mild 459 -.086 / .066 -.032 / .490 Moderate 459 -.166 / .000 -.175 / .000 Strenuous 459 -.109 / .020 -.073 / .116 Total 459 -.177 / .000 -.140 / .003 Pearson’s correlation coefficients; p<.05 is significant.

n Low activity Medium activity High activity F ratio Adj F ratio Mean ± SD Mean ± SD Mean ± SD Physical Symptoms 268 41.18 ± 17.41 39.95 ± 18.19 34.64 ± 15.93 8.33 2.11 Mental Symptoms 268 15.10 ± 7.13 a 14.64 ± 6.87 b 11.81± 6.01 ab 8.97* 4.62* 1 Physical Symptoms 409 14.75 ± 6.75 a 14.66 ± 7.13 12.79 ± 6.59 a 3.96* 5.07* 2 Mental Symptoms 409 42.40 ± 18.33 abc 39.78 ± 17.04 abc 34.95 ± 16.52 abc 7.43* 3.26* 3 ANOVA, p <. 05; groups with s ame letters differ significantly. 1 ANCOVA adj means: 14.88 , 14.77, 11.92, p ƞ 2 = 0.038; 2 ANCOVA adj means: 14.82 , 14.67, 12.71, pƞ2= 0.022. 3ANCOVA adj means: 41.12, 40.03, 35.91, pƞ2= 0.016.Results- Comparison of GroupsTotal ExModerate Ex

Discussion Moderate exercise (and total) was associated with lower severity of menopausal symptoms, and those who reported not engaging in moderate exercise had more mental symptoms.Those who reported less total exercise had more menopausal symptom severity than those who reported more total exercise.Association of aerobic exercise and fewer physical and mental symptoms in menopause studies 37,38 37. Kim, 2014; 38. Gutierrez, 2012

Key Findings Vegans report lower severity of physical menopausal symptoms than omnivoresMultiple factors were associated with lower severity of menopausal symptoms Decreased Symptom Severity Increased Symptom Severity Vegan Diet Age BMI Sleep Hours Social Support Sweets, Fast & Convenience Foods, Grapes, Coffee, Milk, Orange/Grape Juices, Soda, Green/Black Tea, Dark Chocolate, Beef Physical Activity Education Berries, Tree fruit, Spinach, Pomegranate Juice, Plant Omega-3

Strengths and Limitations Strengths Large sample sizeExploration of a topic with limited previous researchIncluded many data points Limitations Length and personal nature of questions Self-reported data Retrospective Food frequency only Low generalizability Correlational study

Conclusion A plant-based diet may ease the menopausal transitionBeing physically active and healthier eating habits (“slow” food) may also be beneficial Images courtesy of sirrichards.com and tattly.com

Future Research Experimental study with vegan vs omnivore diet in menopausal women Duration of adherence to a vegan diet in menopausal womenInvestigation of premenstrual symptoms and plant-based diet

Questions? Thank you for listening!Image courtesy of publicdomainpictures.net