/
ECONOMIC COMMENTARIES NO. 1, 2014 ECONOMIC COMMENTARIES NO. 1, 2014

ECONOMIC COMMENTARIES NO. 1, 2014 - PDF document

cheryl-pisano
cheryl-pisano . @cheryl-pisano
Follow
383 views
Uploaded On 2017-01-13

ECONOMIC COMMENTARIES NO. 1, 2014 - PPT Presentation

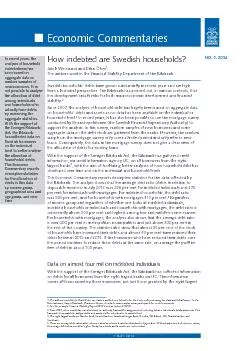
conomic ommentaries NO 1 2014 7 MAY 2014In recent years the analysis of household indebtedness has been based on aggregate data or random samples of new borrowers It is not possible to analyse the ID: 509348

conomic ommentaries NO. 2014 7 MAY

Share:

Link:

Embed:

Download Presentation from below link

Download Pdf The PPT/PDF document "ECONOMIC COMMENTARIES NO. 1, 2014" is the property of its rightful owner. Permission is granted to download and print the materials on this web site for personal, non-commercial use only, and to display it on your personal computer provided you do not modify the materials and that you retain all copyright notices contained in the materials. By downloading content from our website, you accept the terms of this agreement.


Presentation Transcript

ECONOMIC COMMENTARIES NO. 1, 2014 conomic ommentaries NO. 1, 2014 7 MAY 2014In recent years, the analysis of household indebtedness has been based on aggregate data or random samples of new borrowers. It is not possible to analyse the allocation of debt among individuals and households who actually have debts by examining the aggregate statistics. With the support of the Sveriges Riksbank Act, the Riksbank has collected data on Swedish borrowers on the individual level to better analyse the allocation of households' debts. This Economic Commentary reports descriptive statistics for the allocation of debts in this data by income group, geographical area and age group, and over time.How indebted are wedish households?Jakob Winstrand and Dilan Ölcerhe authors work in the Financial tability Department of the iksbank.wedish households’ debts have grown substantially in recent years and are high from a historical perspective. he iksbank has pointed out, in various contexts, that this development entails risks for both macroeconomic development and nancial stability.ince 2007, the analysis of household debt has largely been based on aggregate data on households’ debts and assets as no data has been available on the individual or household level.n recent years, it has also been possible to use the mortgage survey conducted by Finansinspektionen (the wedish Financial upervisory uthority) to support the analysis. n this survey, random samples of new borrowers and some aggregate data on the debt stock are gathered from the banks. However, the random samples in the mortgage survey only cover a limited period and only refer to new loans. onsequently, the data in the mortgage survey does not give a clear view of the allocation of debts for existing loans.With the support of the veriges iksbank ct, the iksbank has gathered credit information, via credit information agency U, on all borrowers from the eight largest banks, with the aim of facilitating better analyses of how household debt has developed over time and on the individual and household levels. his conomic ommentary reports descriptive statistics for the data collected by the iksbank. he analysis shows that the average debt ratio (debts in relation to disposable incomes) in July 2013 was 296 per cent for indebted individuals and 370 per cent for individuals with mortgages. For indebted households, the debt ratio was 263 per cent, and for households with mortgages 313 per cent.egardless of income group and regardless of whether one looks at indebted individuals, indebted households or individuals and households with mortgages, the debt ratio is consistently above 200 per cent and highest among low and middle income earners. For households with mortgages, the analysis also shows that the average debt ratio is over 400 per cent in metropolitan municipalities and just above 300 per cent in the rest of the country. he statistics also show that almost 25 per cent of the stock of households have increased their debts and almost 60 per cent have reduced their debts between 2012 and 2013. f the borrowers who have reduced their debts over this period continue to reduce these debts at the same rate, on average they will be free of debt in about 100 years.Data on almost four million indebted individualsWith the support of the veriges iksbank ct, the iksbank has collected information on debts for all borrowers from the eight largest banks via Uhis information covers all loans raised by these borrowers, not just those granted by the eight largest 1. he authors would like to thank Peter van anten and rik von chedvin for their help with processing the data and oa Possne, ecilia oos-saksson, Kasper oszbach, arianne terner, nnika vensson and seminar participants for useful comments.2. ee, for example, Financial tability eport 2013:2 and af Jochnick (2014).3. ince 2007, when wealth tax was abolished, no authority has had the assignment of collecting data on individual’s debts and assets. his has made it impossible to analyse debts and assets on the individual or household level.4. he eight largest banks are Danske Bank, Handelsbanken, Länsförsäkringar Bank, ordea, B Bank, SEB, kandiabanken and wedbank. 5. hese are average debt ratios after extreme values have been treated as described in ppendix 2. Without adjustment of extreme values, the average debt ratios would be higher. tudy-loan debts and tax debts are not included. ECONOMIC COMMENTARIES NO. 1, 2014 banks.he volume of loans in the data set covers about 80 per cent of household loans from monetary nancial institutions (s) and 94 per cent of all mortgages.he data set includes monthly data from July 2010 until July 2013 on various types of credit, taxed earned income after tax, number of co-borrowers, taxation value (only for detached houses), the parish in which the borrower is registered and other information. his means that we have a panel of borrowers extending over 37 months. has obtained data on taxed earned income from the wedish ax gency. However, data on wealth or the value of any tenant-owned housing in the material is unavailable. Denitions are explained in detail in ppendix 1, which also includes a list of variables. ppendix 2 describes how data has been managed and ppendix 3 includes descriptive statistics. he material includes information on almost four million indebted adult individuals, which corresponds to 52 per cent of weden’s total adult population.hese individuals can be linked to just over 1.8 million households (see ppendix 1 for a description of the household variable). n average, a household consists of 1.7 individuals, with 35 per cent being single-person households.he total amount of debt in the data amounted to SEK 2,257 billion in July 2013. f this loan volume, 95 per cent consisted of mortgages, 0.6 per cent of credit card debts and 4.3 per cent of other types of debt.10bout three million individuals and 1.5 million households have mortgages. able 1 illustrates the average disposable incomes and debts for indebted persons with and without mortgages on both the individual and household levels. he table shows that, on average, individuals and households with mortgages have higher incomes after tax but also higher debts than the average for all indebted persons.he average indebted individual has three loans, is 50 years of age, and has a debt ratio of 296 per cent.Table 1. Disposable incomes and total debt at the individual and household level NCOME ATER TAXOTAndividualverage240,623586,885edian218,400394,221ndividual with mortgageverage244,645721,238edian223,300541,109NCOME ATER TAXOTAHouseholdverage409,736990,400edian374,600650,618Household with mortgageverage422,0631,177,045edian394,200845,750ote. Data from July 2013. ee ppendix 2 for a description of how data has been managed and ppendix 3 for descriptive statistics. he values in this table correspond to those in ables 5-8 in ppendix 3.ource: he iksbankndebtedness among wedish individuals and householdss most households pay their borrowing costs from their current incomes, debt as a proportion of disposable income (the debt ratio) provides a good measure of household indebtedness. he debt ratio can also be used to describe the potential interest expenditure as a proportion of disposable income. f the debt ratio is high, changes in interest rates or incomes may make interest expenditure such a great burden that a household is forced to cut back on other consumption or use other assets to meet its 6. he data includes all loans registered by U7. hese percentages are after adjustment for extreme values (see ppendix 2). ccording to tatistics weden, loans from s to households amounted to SEK 2,826 billion in July 2013, with 81 per cent of these being mortgages. 8. ccording to tatistics weden, 7.7 million people aged over 17 were resident in weden in 2013.9. ccording to tatistics weden, there were a total of just over four million households in weden in 2012 and, of these, 37 per cent were single-person households and 31 per cent were two-person households.10. redit card debts can be underestimated as they are usually repaid at the end of each month.11. n all cases, the median is lower than the average, which indicates that certain incomes and debts are very high. ECONOMIC COMMENTARIES NO. 1, 2014 interest expenditure. n other words, the higher the debt ratio is, the more vulnerable the household becomes to loss of income and interest rate increases.o provide a better view of indebtedness, in this section we will rst review the debt ratio on the aggregate level. fter this, we will examine indebted individuals in various income groups and age groups, followed by a review of the debt ratio for indebted households in different income groups. s mortgages form such a large proportion of loans and over three-quarters of all households have mortgages, we will describe these separately. Furthermore, from a risk perspective, it is important to analyse individuals and households with mortgages as the wedish banks have large exposures towards mortgage borrowers.he debt ratio for the entire wedish household sector is usually based on aggregate statistics from tatistics weden and is calculated as the household sector’s total debt as a percentage of its total income. his is hereafter referred to as the aggregate debt ratio. n the fourth quarter of 2013, the aggregate debt ratio was 174 per cent, which is high from a historical perspective (see hart 1). 50 70 90 110 130 170 190 70 73 76 79 82 85 88 91 94 97 00 03 06 09 12 15 Chart 1. Aggregate debt ratioPer centNote. Tax debts and study-loan debts are included in the aggregate debt ratio.Sources: Statistics Sweden and the Riksbank When the debt ratio is calculated at aggregate level, the wedish population's total debts are divided by their total disposable incomes. ndividuals who have no debts but do have an income are thereby also included. he level of the debt ratio is therefore affected by the number of indebted households. When data is used on an individual level, it is possible to calculate an average debt ratio for indebted persons with and without mortgages. However, this calculation can be made in two ways: either as total debts divided by total disposable incomes (that is, in the same way as the aggregate debt ratio is calculated) or as an average of separate individuals' debt ratios.t is also possible to calculate an average of individual households' debt ratios. hart 2 compares the aggregate debt ratio for the entire population with that for indebted persons with and without mortgages. alculating debt ratios for individuals and households who are indebted gives a better view of how vulnerable they actually are. s the chart shows, the debt ratio is higher for indebted persons with and without mortgages than it is for the population of weden as a whole. n the remaining part of this conomic ommentary, all average debt ratios have been calculated as a mean value of separate individuals' and households' debt ratios. 12. s information on interest-rate conditions and the value of housing or assets is not available in the iksbank’s credit data, it is not possible to calculate other measures such as interest ratio, loan-to-value ratio or net equity/assets ratio. onsequently, the analysis of this conomic ommentary is largely restricted to debt ratios.13. When the average debt ratio is calculated as total debts divided by total incomes, it corresponds to the income-weighted average of individual debt ratios. ECONOMIC COMMENTARIES NO. 1, 2014 \r\f\r \r\n\t\r\b\f\r\n \r\r\t\r\b\n\r\f\r\t\r\b\r\r\f\n \n\t\n\n\n\r\f\r\n\n\r\f\r\n\t\t\r\f\r \r\b ­\r\r\t\r\r\f\n\r\n\n\r\r\r\r\n\r\t\r\b\n\n\r\r\f€\r\r\r\t\r\r\r\f\r  \r\n\b\f\r\n \r  \r\n\n\n \r\r\t\r\r\n\r\b\r\r\r\n\r\r\f­\r\f\r\r\f\b‚\n \n\t\n\n\n\r\f\r\r\n‚\r\t\t\r\t\r\r\f\n\n\b \f\r\r\r\f  \r\n\t\rƒ„\f\n„ \r† \r‡† †\r\r\n\n\rƒ„\f\n„Chart 2. Debt ratios for different groupsˆ\r \r\n Highest debt ratios among individuals with low incomeshe just less than four million indebted individuals in the data material have been divided into ten income deciles and ten age deciles (decile and group are hereafter used synonymously). ncome decile one is the tenth of individuals with the lowest incomes and income decile ten is the tenth with the highest incomes. hart 3 shows the average debt ratio on the individual level in each income group. t shows that the debt ratio on the individual level averages 200 per cent or more in all income groups, and is highest in the lower income groups.he average debt ratio for all indebted individuals is 296 per cent, which is higher than the aggregate debt ratio. For individuals with mortgages, the average debt ratio is 370 per cent. he total debts among the indebted individuals with the highest incomes (income decile ten) correspond to about 18 per cent of the total debts (see able 2). 14. However, the high debt ratio in the lowest income group should be interpreted with a certain amount of caution, as this group includes, among others, households with highly varied incomes. For example, the group may include self-employed individuals who may have made a loss in a certain year or a large capital gain resulting in a high level of tax and who thus paid no income tax in that year. ECONOMIC COMMENTARIES NO. 1, 2014 1 2 3 4 5 6 7 8 9 10 Income decilesNote. Data from July 2013. The average disposable income per individual was as follows for each income decile: 1: SEK 70,557, 2: SEK 125,414, 3: SEK 157,692, 4: SEK 184,734, 5: SEK 207,726, 6: SEK 229,316, 7: SEK 253,289, 8: SEK 283,804, 9: SEK 328,615, and 10: SEK 565,169. The debt ratio has been calculated as the average debt ratio in each income decile. See Appendix 2 for a description of how data has been managed and Appendix 3 for descriptive statistics.Source: The RiksbankChart 3. Debt ratios for indebted individuals in different income groupsPer cent 0 100 200 500 600 Table 2. Proportion of total debts and incomes, per income decile for indebted individuals DISOSABLE INCOMESOTATSncome decileotal disposable incomes SEK billion)Percentage of total disposable incomesotal debts SEK billion)Percentage of total debts2.91838.15.21526.76.61707.57.71858.28.61918.59.52008.910.52199.710911.825111.112613.729212.921723.541418.4ll deciles9251002,257100ote. Data from July 2013. ee ppendix 2 for a description of how data has been managed and ppendix 3 for descriptive statistics.ource: he iksbankhe distribution among different age groups shows that younger borrowers have higher debt ratios than older ones (see hart 4). t the same time, the average debt ratio is lower in the youngest group than it is in the second youngest one. ne explanation for this could be that there are fewer individuals with large loans, for example mortgages, in the group with the youngest borrowers. f we instead examine individuals with mortgages, the debt ratios are signicantly higher in all age groups. For example, the debt ratio is 252 per cent for mortgage borrowers in the oldest age group. ECONOMIC COMMENTARIES NO. 1, 2014 Age deciles (average age within decile)Note. Data from July 2013. The debt ratio has been calculated as the average debt ratio in each age decile. See Appendix 2 for a description of how data has been managed and Source: The RiksbankChart 4. Debt ratios for indebted individuals in different age groupsPer cent 0 50 100 150 200 350 400 1 (27) 2 (33) 3 (38) 4 (42) 5 (47) 6 (51) 7 (56) 8 (61) 9 (66) 10 (76) For households with mortgages, the debt ratios are highest among low-income earnersany borrowers live in households with more than one wage-earner and also share the obligation to pay for the loan. n the individual-level statistics, the total debt for an individual is calculated as the sum of the personal loans and the proportion of the loans for which the individual has a shared obligation to pay. his means that, in a household with loans with a shared obligation to pay and in which there is one person with a low income and one person with a high income, one person will have a high debt ratio and the other a low debt ratio. nalysing households instead of individuals thus evens out the debt ratios for such households. onsequently, it can be important to also examine debts on the household level (see ppendix 1 for a description of the household variables).he iksbank’s statistics over indebted households show that debt ratios among all income groups are higher than the aggregate debt ratio based on statistics from tatistics weden (see hart 5). f the rst income group is disregarded, debt ratios are highest among average income households. he total debts among the indebted households with the highest incomes correspond to 19 per cent of the total debts (see able 3). ECONOMIC COMMENTARIES NO. 1, 2014 1 2 3 4 5 6 7 8 9 10 Income deciles Note. Data from July 2013. The average disposable income for households was as follows for each income decile: 1: SEK 106,518, 2: SEK 186,745, 3: SEK 237,848, 4: SEK 288,675, 10: SEK 970,366. The debt ratio has been calculated as the average debt ratio in each income decile. See Appendix 2 for a description of how data has been managed and Appendix 3 for descriptive statistics.Source: The RiksbankChart 5. Household debt ratios in different income groupsPer cent 0 100 200 he debt ratios are higher in all income groups among households with mortgages than they are among indebted households in general, and the highest debt ratios are found among the lowest income groups. n all income groups, the average debt ratio is above 200 per cent (see hart 6). Table 3. Proportion of total debts and incomes, per income decile for indebted households DISOSABLE INCOMESOTATSncome decileotal disposable incomes SEK billion)Percentage of total disposable incomesotal debts SEK billion)Percentage of total debts2.64.64.6915.15.81076.07.01367.68.41689.4729.818810.511.020011.212.522012.310814.625414.217523.734019.0ll deciles7381001,784100ote. Data from July 2013. ee ppendix 2 for a description of how data has been managed and ppendix 3 for descriptive statistics.ource: he iksbank ECONOMIC COMMENTARIES NO. 1, 2014 1 2 3 4 5 6 7 8 9 10 Income deciles Note. Data from July 2013. The average disposable income for households was as follows for each income decile: 1: SEK 117,362, 2: SEK 204,114, 3: SEK 258,400, 4: SEK 313,508, 5: SEK 368,859, 6: SEK 417,514, 7: SEK 464,757, 8: SEK 520,950, 9: SEK 606,715, and 10: SEK 948,734. The debt ratio has been calculated as the average debt ratio in each income decile. See Appendix 2 for a description of how data has been managed and Appendix 3 for descriptive statistics.Source: The RiksbankChart 6. Debt ratios in different income groups for households with mortgagesPer cent 0 100 200 ndebtedness in various regionshis section describes the geographic allocation of indebted households with mortgages. hart 7 shows how the debt ratio for households with mortgages is over 400 per cent, which is to say about 100 percentage points higher in the three metropolitan municipalities than in other municipalities. s the allocation is by municipality, the group “others” also includes certain parts of the metropolitan areas that are not included in the metropolitan municipalities. n examination of the proportion of total debts shows that 86 per cent of these are outside the three metropolitan municipalities (see hart 8). f the debts held by households with mortgages, 6.6 per cent are in tockholm unicipality.f we look at the county level instead, we see that about one-quarter of the total debts are in tockholm ounty, one-sixth are in Västra Götaland ounty and one-seventh are in kåne ounty.n July, the average debt ratios for households with mortgages were 430 per cent in tockholm ounty, 324 per cent in Västra Götaland ounty, 352 per cent in kåne ounty and 265 per cent in the rest of the country. \r\f \n\t\b  \b\b \f  \b ­\b\b\b\r\b\b\n\b   €\b\f ‚ƒ„\r\bChart 7. Debt ratios for households with mortgages in different municipalities…  15. n total, 57.5 per cent of debts for households with mortgages are in the metropolitan counties. t the same time, these counties make up 52 per cent of the wedish population. ECONOMIC COMMENTARIES NO. 1, 2014 0 1 2 6 7 Stockholm GothenburgMalmö Note. Data from July 2013. See Appendix 2 for a description of how data has been managed and Appendix 3 for descriptive statistics.Source: The RiksbankChart 8. Proportion of total debts in different municipalities, for households with mortgagesPercentage he development of debts over timene advantage of the data set to which the iksbank has access is that it allows us to follow individuals over time. his also allows us to analyse how their debts have changed. ccording to hart 9, debt ratios for individuals with mortgages have increased in most income groups. ven though these increases do not seem signicant, debt ratios increased by more than ten percentage points between July 2010 and July 2013 in many income groups, above all the higher ones. he largest increase was in income group eight, in which the average debt ratio for mortgage borrowers increased by about 19 percentage points. 1 2 3 4 5 6 7 8 9 10 Jul-10 Jul-11 Jul-12 Jul-13 Income deciles Note. The average disposable incomes for individuals with mortgages at the four dates were Source: The RiksbankChart 9. Debt ratios in different income groups for individuals with mortgagesPer cent 0 200 400 600 800 1,000 1,200 nalysing the development of debts over time can give an indication of the state of individuals’ amortisations. s amortisations according to the loan agreement are not included in the data set, we have instead examined the change in the debt balance from one year to the next. hese rates of change should not be interpreted as amortisations according to contract, but as net amortisations, which is to say amortisations minus newly-raised loans. ECONOMIC COMMENTARIES NO. 1, 2014 Between July 2012 and July 2013, 24 per cent of individuals with mortgages increased their debts, 16 per cent had an unchanged level of debt and 60 per cent decreased their debts (see hart 10). f the individuals that had reduced their debts continue to do so at the same rate as between July 2012 and July 2013, these individuals will become debt-free after an average of 99 years. 24 per cent of individuals with a mortgage during this period reduced their total debt at a rate corresponding to an amortisation period of 50 years or more. For this 24 per cent, the average rate of change corresponds to an amortisation period of 216 years.en per cent of individuals pay off their debt over an average of 39 years, 16 percent over 19 years and ten per cent over ve years. ver the three years for which there is data, the proportion of individuals reducing their debts has increased and the proportion increasing their debts has decreased. However, we now have a greater share of individuals reducing their debts at an ever-slower pace (see hart 11). Increased Note. See Appendix 2 for a description of how data has been managed and Appendix 3 for descriptive statistics.Source: The RiksbankChart 10. Change in debt for individuals with mortgages (July 2012-July 2013)Percentages 241016102416 0 5 10 25 30 Increased0 to 10 years 10 to 30 30 to 50 �50 years Unchanged 2010-2011 2011-2012 2012-2013 Note. 2010-2011 refers to July 2010 to July 2011, 2011-2012 is July 2011 to July 2012, and 2012-2013 is July 2012 to July 2013. See Appendix 2 for a description of how data has been managed and Appendix 3 for descriptive statistics.Source: The RiksbankChart 11. Change in debt for individuals with mortgagesPercentages eferencesf Jochnick, Kerstin, 2014, Why does the Riksbank care about household indebtedness?veriges iksbank.Financial Stability Report 2013:2veriges iksbank. 16. he rates of change do not necessarily reect actual amortisations or maturities. ECONOMIC COMMENTARIES NO. 1, 2014 ppendix 1. Description of variables VARIADEINITIONDisposable incomeaxed earned income +/- capital surplus/decit – nal tax has obtained data on taxed earned income from the wedish ax gency.LKF code ounty, municipality and parish code.Postal codeFive-gure postal code.he person’s age is given in years and is updated at the month of their birth.erial number, addresshe address is given as a serial number so that individuals cannot be identied.erial number, personach individual is assigned a serial number to prevent the person being identied by their personal identity number.erial number, creditach loan has a serial number.redit type redit type reects the purpose of the credit. he different categories are credit card, repayment, collateral-free loan, loan against collateral, real estate mortgage, leasing and mortgage against collateral in tenant-owned apartment. mortgage borrower is dened as a person with a mortgage against either real estate or collateral in a tenant-owned apartment. tudy loans and tax debts are not included.redit balancehe balance of each loan has been divided by the number of borrowers so that each individual’s balance reects their part of the loan. n the iksbank’s data, the balance is updated on the rst day of the month.umber of co-borrowers umber of persons who are co-borrowers of the loan.Household s exact information on the individuals included in a household was not available to the iksbank, a household has been dened as individuals living at the same postal address and having a joint loan. ll data presented at the household level is the sum of the variables in question for the individuals included in the household according to this denition. n example of one limitation of this denition is that two persons living together appear to be a single-person household if only one of them has raised a loan. When the debt ratio is calculated for such a household, for example, the income of the second person is not captured. onsequently, the debt ratio can be calculated as higher than it actually is. ECONOMIC COMMENTARIES NO. 1, 2014 ppendix 2. anagement of dataWith the support of the veriges iksbank ct, the iksbank originally received two data sets from Une of these was panel data on the credit level, which specied, among other things, the balance of credit, the type of credit and the individuals (according to serial number, person) with obligation to pay for the credit. he other panel data set, which was on the personal level, included information on individuals’ incomes, taxes, ages, postal addresses and other details. he iksbank has only examined these statistics after individuals’ personal identity numbers and postal addresses have been replaced by serial numbers. Data at the individual levelo create a panel data set on the individual level with the sum of the personal loans, the two data sets were combined using the serial number for the person. ertain considerations were necessary in the management of the data material.n the rst stage of the data management, we divided the sum of the loan amount by the number of persons listed as co-borrowers, so two individuals acting as co-borrowers for a loan of SEK 1 million would each have a debt of SEK 500,000. nly this share has been included in the individual’s total debts.he second stage involved eliminating loans for which the number of co-borrowers does not match the persons raising the loan. his corresponded to one per cent of the total number of loans.Having created a data set of loans on the individual level, we had to eliminate certain observations, for example to make an analysis of debt ratios possible. n the third stage of data management, we therefore assumed that the individual has a taxed income and at least one loan. n the fourth stage, we removed observations in which individuals only have a debt but no declared income. However, this only affected a small proportion of the observations, about one per cent. n the fth stage, we excluded individuals with a declared disposable income of exactly SEK 0, as no debt ratio could be calculated for them. his corresponded to 0.4 per cent of observations. n the sixth stage, we eliminated observations in which information on age was absent. his removed 0.2 per cent of observations. n the seventh stage, we eliminated observations in which disposable income was negative. Given the previous stages, eliminations in this stage corresponded to 1.6 per cent of observations.he nal stage of data management on the individual level involved the exclusion of individuals with only an unused limit, for example if an individual has a credit card with a limit of SEK 10,000 that he or she does not use. ncluding these individuals would mean including individuals without one krona in actual debt. f we had instead dened debts as limits and not actual debts, the debts in this conomic ommentary would have been higher. his stage results in the removal of 8.7 per cent of the observations. large part of the statistics presented in this conomic ommentary examine mortgage borrowers’ total debt burden. mortgage borrower is dened as a person who holds a mortgage against real estate or against collateral in a tenant-owned apartment. he debts reported for the mortgage borrowers refer to their total debts and not just their mortgages. s the iksbank did not have access to information on actual amortisations, the calculation of the rate of repayment has been based on how the debt balance changed between July of one year and July of the following year. onsequently, we have only included those individuals with debts in both periods. f an individual repays their entire debt and disappears from the data material, that individual’s repayment will therefore not be included in the calculation. imilarly, individuals who only have a debt in the second period are not included in the calculation of repayment rates. ECONOMIC COMMENTARIES NO. 1, 2014 Data at the household levelnce we had compiled a data set of debts on the individual level, we also wanted to create a data material on the household level. he iksbank does not have access to information on the individuals included in a household according to the denition used by tatistics weden. onsequently, we created a household variable in which individuals with the same postal address and serial number for a loan, which is to say a joint obligation to pay, were dened as a household.s mentioned above, one advantage of examining debts on the household level is that individuals in a household often have joint responsibility for loans. For example, if one member of a household has a high income and the other a low income, this will affect the debt ratio, as one will have a low debt ratio and the other a high one. onsequently, an analysis on the household level can provide a better view of the debt burden as the debt ratio is based on the household’s total debt and total income. However, one disadvantage of this denition of the household variable is that it does not capture all incomes in a household where, for example, there are two incomes but only one person has a formal obligation to pay for the loan. debt ratio for this household should be interpreted as an upper limit, as only the income for the person with the obligation to pay is included in the calculation. Just as on the individual level, we exclude households with SEK 0 in actual total debt. his removed 6.3 per cent of observations on the household level.When the household variable was created according to the matching described above, we discovered certain households that consisted of an unreasonable number of individuals.o prevent these households from distorting the results, we decided to eliminate households consisting of ve or more borrowers. his elimination removed almost 4.6 per cent of households. ccording to tatistics weden, 37 per cent of wedish households are single-person households and 31 per cent are two-person households. ccording to our denition of households, 35 per cent of the credit data set consists of single-person households and 59 per cent of two-person households. However, it is difcult to compare these gures as we have measured the size of the household in terms of the number of borrowers, whereas tatistics weden has used the number of adults and children. ur assessment is that the results reported in this conomic ommentary would not be greatly different if we had chosen to dene households in the same way as tatistics weden.he panel data set on the household level is based on the data set on the individual level. n cases in which an individual has a loan together with a person outside the household, the proportion of the loan outside the household which accrues to the individual within the household will be included in the household’s total debt.Management of extreme valueshe calculation of debt ratios on the individual or household levels leads to certain extreme values, which is to say very high debt ratios. f these extreme values are included in the statistics, they can have a great impact on the average debt ratio, even if it is only a matter of a few individuals. ne alternative would be to exclude all of these individuals from the data material. However, so as not to lose observations, we have instead chosen to apply a generally accepted method for managing extreme values known as Winsorisation. When calculating debt ratios on the individual and household levels, we Winsorised the ninety-ninth percentile. n practice, this means that extreme values were replaced by values in the ninety-ninth percentile. berrant observations are thus given less weight and the calculation of the average becomes based on more representative individuals. he median is not affected by extreme values and thus not by Winsorisation. he affect of Winsorisation on the mean value of the debt ratio is illustrated by able 4. his shows that debt ratios are signicantly higher if Winsorisation is not applied. 17. hildren are thereby not included in this denition of households.18. For example, we had households that consisted of over 500 persons and, as we cannot accept that these are actually households, we chose to eliminate households consisting of ve or more persons. 19. s only individuals raising loans are included in the data set, children for example are not included in the calculation. 20. he denition of household applied in this conomic ommentary gives rise to debt ratios that are consistent with ratios based on tatistics weden’s denition of households. 14ECONOMIC COMMENTARIES NO. 1, 2014 Table 4. Debt ratios with and without Winsorisation DUDUS MORTESHOSEHOSELDS ITMORTESWith Winsorisation296370263313Without Winsorisation583715397469ote. Data from July 2013. ource: he iksbank ECONOMIC COMMENTARIES NO. 1, 2014 Table 5. Descriptive statistics for indebted individuals Indebted individualsYEARARIAERAP5P10P25IANP75P90AXNUER ODU2010Disposable income (SEK thousand)215143197253324390284,0303673,699,9852011Disposable income (SEK thousand)22672100150207268345416354,4873293,777,4252012Disposable income (SEK thousand)235103154213276355430410,6734523,813,9042013Disposable income (SEK thousand)241107158218283364438381,3334993,845,9762010otal debt (SEK thousand)5041083317081,1821,525190,0006693,699,9852011otal debt (SEK thousand)5383537581,2561,625332,9047623,777,4252012otal debt (SEK thousand)5641183758001,3091,693425,0767993,813,9042013otal debt (SEK thousand)5871223948331,3581,750438,5288323,845,9762010ortgage debt (SEK thousand)4763116861,1521,500190,0006543,699,9852011ortgage debt (SEK thousand)509727351,2291,590329,8517453,777,4252012ortgage debt (SEK thousand)5357701,2781,650415,9767763,813,9042013ortgage debt (SEK thousand)5593728051,3281,715429,5908153,845,9762010redit card debt (SEK thousand)151,2843,699,9852011redit card debt (SEK thousand)1,1983,777,4252012redit card debt (SEK thousand)1,3843,813,9042013redit card debt (SEK thousand)3,2133,845,9762010ther debts (SEK thousand)13185,0001273,699,9852011ther debts (SEK thousand)15136100,0001223,777,4252012ther debts (SEK thousand)13795,7261223,813,9042013ther debts (SEK thousand)13890,0691193,845,9762010otal debt/Disposable income (%)293121723636399352,8384183,699,9852011otal debt/Disposable income (%)2911753666319122,7474053,777,4252012otal debt/Disposable income (%)2921803746389122,5783903,813,9042013otal debt/Disposable income (%)2961853806449182,5923923,845,9762010ortgage debt/Disposable income (%)2741603496199032,6654013,699,9852011ortgage debt/Disposable income (%)2721636118802,5813883,777,4252012ortgage debt/Disposable income (%)2741693606198822,4403763,813,9042013ortgage debt/Disposable income (%)279 401743676268912,4693803,845,9762010redit card debt/Disposable income (%)3,699,9852011redit card debt/Disposable income (%)3,777,4252012redit card debt/Disposable income (%)3,813,9042013redit card debt/Disposable income (%)3,845,9762010ther debts/Disposable income (%)1853,699,9852011ther debts/Disposable income (%)1843,777,4252012ther debts/Disposable income (%)121713,813,9042013ther debts/Disposable income (%)12701573,845,9762010491033,699,985201149104153,777,4252012105153,813,90420134970104153,845,976ote. For each year, the values are revised as per 1 July. ee ppendix 1 for a denition of the variables. otal debt refers to the sum of the balances of all individual types of loan. ortgages refers to loans against real estate or against collateral in tenant-owned apartments. redit card debt refers to debts from credit cards and debit cards. ther debts refers to total debts minus mortgages and credit card debts. For the variables "total debt/disposable income", "mortgage/disposable income", "credit card debt/disposable income" and "other debts/disposable income", extreme values have been managed as described in ppendix 2. mounts are expressed in SEK thousands, which means that the zeros in the minimum values for incomes and total debts are less than SEK 500 but greater than zero. ource: he iksbankppendix 3. Descriptive statistics ECONOMIC COMMENTARIES NO. 1, 2014 Table 6. Descriptive statistics for individuals with mortgages Individuals with mortgagesYEARVARIAERAP5 P10P25IANP75P90P95AXNUER ODU2010Disposable income (SEK thousand)22072147201259401284,0303252,931,8892011Disposable income (SEK thousand)232104155212276355427354,4872982,991,0372012Disposable income (SEK thousand)239107158218283365441320,6133443,040,8072013Disposable income (SEK thousand)245110162223290373448381,3333703,073,8432010otal debt (SEK thousand)621701132304558271,2961,650190,0007002,931,8892011otal debt (SEK thousand)6651192464921,3801,754332,9048072,991,0372012otal debt (SEK thousand)6941242565149281,4331,823425,0768453,040,8072013otal debt (SEK thousand)7211282685419681,4861,890438,5288773,073,8432010ortgage debt (SEK thousand)6011052178021,2691,613190,0006822,931,8892011ortgage debt (SEK thousand)6432314698601,3501,717329,8517842,991,0372012ortgage debt (SEK thousand)671721162434959001,4001,785415,9768153,040,8072013ortgage debt (SEK thousand)6991212525169401,4521,850429,5908563,073,8432010redit card debt (SEK thousand)121,2842,931,8892011redit card debt (SEK thousand)151,1982,991,0372012redit card debt (SEK thousand)9763,040,8072013redit card debt (SEK thousand)8563,073,8432010ther debts (SEK thousand)10485,0001052,931,8892011ther debts (SEK thousand)20113100,0001152,991,0372012ther debts (SEK thousand)2011795,7261203,040,8072013ther debts (SEK thousand)2011880,2951073,073,8432010otal debt/Disposable income (%)3691182334257181,0593,7285032,931,8892011otal debt/Disposable income (%)3661212374277071,0303,6094862,991,0372012otal debt/Disposable income (%)3651232434347121,0233,3584603,040,8072013otal debt/Disposable income (%)3701262484397171,0303,3604623,073,8432010ortgage debt/Disposable income (%)3572234137021,0333,6154892,931,8892011ortgage debt/Disposable income (%)3541142274146891,0033,4874712,991,0372012ortgage debt/Disposable income (%)3541162334216949973,2634483,040,8072013ortgage debt/Disposable income (%)358 1194277011,0083,2814523,073,8432010redit card debt/Disposable income (%)2,931,8892011redit card debt/Disposable income (%)2,991,0372012redit card debt/Disposable income (%)3,040,8072013redit card debt/Disposable income (%)3,073,8432010ther debts/Disposable income (%)1522,931,8892011ther debts/Disposable income (%)1562,991,0372012ther debts/Disposable income (%)1503,040,8072013ther debts/Disposable income (%)1403,073,8432010491032,931,8892011491042,991,0372012491053,040,8072013491043,073,843ote. For each year, the values are revised as per 1 July. ee ppendix 1 for a denition of the variables. otal debt refers to the sum of the balances of all individual types of loan. ortgages refers to loans against real estate or against collateral in tenant-owned apartments. redit card debt refers to debts from credit cards and debit cards. ther debts refers to total debts minus mortgages and credit card debts. For the variables "total debt/disposable income", "mortgage/disposable income", "credit card debt/disposable income" and "other debts/disposable income", extreme values have been managed as described in ppendix 2. mounts are expressed in SEK thousands, which means that the zeros in the minimum values for incomes, total debts and mortgages are less than SEK 500 but greater than zero.ource: he iksbank 17ECONOMIC COMMENTARIES NO. 1, 2014 Table 7. Descriptive statistics for indebted households Indebted householdsYEARVARIAERAP5P10P25IANP75P90P95AXNUER OSE2010Disposable income (SEK thousand)365103139213335454593713324,3405141,799,4272011Disposable income (SEK thousand)385108146225355482630756411,2804801,784,5982012Disposable income (SEK thousand)400150232365496782410,7506611,795,4422013Disposable income (SEK thousand)410115155375509667800381,6546781,801,7252010otal debt (SEK thousand)8461865521,1872,0082,625190,0001,0401,799,4272011otal debt (SEK thousand)1985941,2782,1582,804177,6561,1481,784,5982012otal debt (SEK thousand)9512056211,3442,2532,924263,5141,2121,795,4422013otal debt (SEK thousand)9902126511,4012,3403,018297,0121,2751,801,7252010ortgage debt (SEK thousand)8021455151,1401,9662,561190,0001,0171,799,4272011ortgage debt (SEK thousand)8611575531,2292,1002,732176,9431,1181,784,5982012ortgage debt (SEK thousand)9041695841,2922,1982,850203,7791,1761,795,4422013ortgage debt (SEK thousand)9441786101,3502,2832,964294,6371,2461,801,7252010redit card debt (SEK thousand)125541,799,4272011redit card debt (SEK thousand)15814121,784,5982012redit card debt (SEK thousand)151,3841,795,4422013redit card debt (SEK thousand)3,2131,801,7252010ther debts (SEK thousand)4012719785,0001791,799,4272011ther debts (SEK thousand)134207100,0001771,784,5982012ther debts (SEK thousand)13721295,7261801,795,4422013ther debts (SEK thousand)13721390,0691771,801,7252010otal debt/Disposable income (%)2591733485807861,7472931,799,4272011otal debt/Disposable income (%)1775737641,6692831,784,5982012otal debt/Disposable income (%)2591813597641,5852761,795,4422013otal debt/Disposable income (%)263121853655847721,6182811,801,7252010ortgage debt/Disposable income (%)2421613345627601,6572851,799,4272011ortgage debt/Disposable income (%)2411653375547391,5782751,784,5982012ortgage debt/Disposable income (%)2441693445607391,5092691,795,4422013ortgage debt/Disposable income (%)249 1743515687511,5552751,801,7252010redit card debt/Disposable income (%)1,799,4272011redit card debt/Disposable income (%)201,784,5982012redit card debt/Disposable income (%)1,795,4422013redit card debt/Disposable income (%)1,801,7252010ther debts/Disposable income (%)121521,799,4272011ther debts/Disposable income (%)12401521,784,5982012ther debts/Disposable income (%)12401431,795,4422013ther debts/Disposable income (%)1301,801,725ote. For each year, the values are revised as per 1 July. ee ppendix 1 for a denition of the variables. otal debt refers to the sum of the balances of all individual types of loan. ortgages refers to loans against real estate or against collateral in tenant-owned apartments. redit card debt refers to debts from credit cards and debit cards. ther debts refers to total debts minus mortgages and credit card debts. For the variables "total debt/disposable income", "mortgage/disposable income", "credit card debt/disposable income" and "other debts/disposable income", extreme values have been managed as described in ppendix 2. mounts are expressed in SEK thousands, which means that the zeros in the minimum values for incomes and total debts are less than SEK 500 but greater than zero.ource: he iksbank ECONOMIC COMMENTARIES NO. 1, 2014 Table 8. Descriptive statistics for households with mortgages Households with mortgagesYEARVARIAERA10IAN90AXNUER OSE2010Disposable income (SEK thousand)378112153232354465600718324,3404521,480,3382011Disposable income (SEK thousand)399119162246375492637762411,2804651,474,9822012Disposable income (SEK thousand)412122166252384506657788320,9074951,490,8152013Disposable income (SEK thousand)422125171258394520673804381,6544781,498,3242010otal debt (SEK thousand)1,0121041733577221,3652,1882,800190,0001,0701,480,3382011otal debt (SEK thousand)1,0841101823797711,4672,3382,988177,6561,1861,474,9822012otal debt (SEK thousand)1,1311131893951,5272,4323,099263,5141,2531,490,8152013otal debt (SEK thousand)1,1771171964108461,5922,5183,210297,0121,3181,498,3242010ortgage debt (SEK thousand)9751586841,3202,1302,731190,0001,0431,480,3382011ortgage debt (SEK thousand)1,0421001673517301,4152,2802,909176,9431,1511,474,9822012ortgage debt (SEK thousand)1,0881021733677631,4812,3753,009203,7791,2101,490,8152013ortgage debt (SEK thousand)1,1351061803848001,5372,4653,142294,6371,2851,498,3242010redit card debt (SEK thousand)5541,480,3382011redit card debt (SEK thousand)814121,474,9822012redit card debt (SEK thousand)1,1881,490,8152013redit card debt (SEK thousand)159871,498,3242010ther debts (SEK thousand)11018185,0001501,480,3382011ther debts (SEK thousand)20120197100,0001701,474,9822012ther debts (SEK thousand)12520295,7261791,490,8152013ther debts (SEK thousand)2012620580,2951611,498,3242010otal debt/Disposable income (%)1142213956308502,0573171,480,3382011otal debt/Disposable income (%)3071162243966198241,9543041,474,9822012otal debt/Disposable income (%)3081182294026228181,8422931,490,8152013otal debt/Disposable income (%)3131202344086281,8792981,498,3242010ortgage debt/Disposable income (%)2991072103836148271,9873091,480,3382011ortgage debt/Disposable income (%)2951082133836018001,8812951,474,9822012ortgage debt/Disposable income (%)2961102183897961,7762851,490,8152013ortgage debt/Disposable income (%)302 1122233956138101,8312921,498,3242010redit card debt/Disposable income (%)151,480,3382011redit card debt/Disposable income (%)1,474,9822012redit card debt/Disposable income (%)1,490,8152013redit card debt/Disposable income (%)1,498,3242010ther debts/Disposable income (%)1291,480,3382011ther debts/Disposable income (%)1331,474,9822012ther debts/Disposable income (%)1291,490,8152013ther debts/Disposable income (%)1191,498,324ote. For each year, the values are revised as per 1 July. ee ppendix 1 for a denition of the variables. otal debt refers to the sum of the balances of all individual types of loan. ortgages refers to loans against real estate or against collateral in tenant-owned apartments. redit card debt refers to debts from credit cards and debit cards. ther debts refers to total debts minus mortgages and credit card debts. For the variables "total debt/disposable income", "mortgage/disposable income", "credit card debt/disposable income" and "other debts/disposable income", extreme values have been managed as described in ppendix 2. mounts are expressed in SEK thousands, which means that the zeros in the minimum values for incomes, total debts and mortgages are less than SEK 500 but greater than zero.ource: he iksbank