/
Exponential Regrowth of Invasive Algae Exponential Regrowth of Invasive Algae

Exponential Regrowth of Invasive Algae - PowerPoint Presentation

cheryl-pisano
cheryl-pisano . @cheryl-pisano
Follow
387 views
Uploaded On 2016-08-07

Exponential Regrowth of Invasive Algae - PPT Presentation

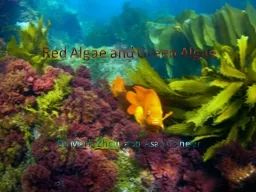
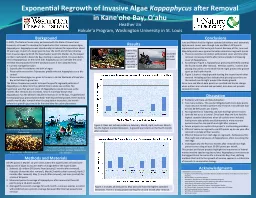
Kappaphycus after Removal in Kane ohe Bay O ahu Heather Jin Hokulea Program Washington University in St Louis Background In 2005 The Nature Conservancy partnered with the State of Hawai ID: 436344

kappaphycus removal points month removal kappaphycus month points june percent growth data supersucker gps months march cover bay marine

Share:

Link:

Embed:

Download Presentation from below link

Download Presentation The PPT/PDF document "Exponential Regrowth of Invasive Algae" is the property of its rightful owner. Permission is granted to download and print the materials on this web site for personal, non-commercial use only, and to display it on your personal computer provided you do not modify the materials and that you retain all copyright notices contained in the materials. By downloading content from our website, you accept the terms of this agreement.


Presentation Transcript

Slide1

Exponential Regrowth of Invasive Algae Kappaphycus after Removal in Kane‘ohe Bay, O‘ahuHeather JinHokule‘a Program, Washington University in St. Louis

BackgroundIn 2005, The Nature Conservancy partnered with the State of Hawai‘i and University of Hawai‘i to develop the SuperSucker that removes invasive algae, Kappaphycus. Kappaphycus was intentionally introduced for aquaculture about 30 years ago. As part of a larger goal to clear the north end of Kane‘ohe Bay from invasive algae by 2015, the SuperSucker went into Marker 12, the largest northern reef patch in Kane‘ohe Bay, starting in January 2013. It is essential to restrict Kappaphycus on the north side; Kappaphycus can overtake the coral reef that encompasses the entire windward coast if not contained now.Current management plan:SuperSucker first removes the bulk of algaePlace native sea urchins Tripneustes gratilla who eat Kappaphycus as a bio-control Vacuumed dead algae are given to farmers in He‘eia Wetlands of Kane‘ohe Bay as fertilizer to grow taro.The Nature Conservancy wants to know the specific regrowth patterns of Kappaphycus to determine the optimal time to place sea urchins. My hypothesis was that percent cover of Kappaphycus would increase as the months after removal also increases. Since it is already known that Kappaphycus has the ability to double its biomass in 15-30 days, I hypothesized that Kappaphycus grows exponentially. With exponential growth, there would a specific month after removal when the population skyrockets; the month before this growth spurt would be the ideal time for urchin placement.

Methods and MaterialsAll GPS points in Marker 12 were areas where the SuperSucker removed over 100 pounds of algae to assume 100% coverage before the SuperSucker.Selected 10 random GPS points from January (5 months after removal), February (4 months after removal), March (3 months after removal), April (2 months after removal), May (1 month after removal), and June (control) for a total of 60 pointsMeasured percent coverage of Kappaphycus after removal at these 60 points using a 16-point quadratAveraged the percent coverage for each month—June was used as a control with predicted zero percent coverage because little time had passed since removal

Results

ConclusionsJune and March had the highest standard deviations and extremely high percent covers even though June and March GPS points represented areas that were just cleared. Because of this, June and May data points were ignored to better determine regrowth trends. There is a positive correlation with percent cover and time after removal; increasing months after removal leads to increasing cover of Kappaphycus. According to Figure 1, Kappaphycus grows exponentially starting the fourth month after removal . Without outliers, it seems that placing sea urchins on the third month might prevent the growth spurt on the fourth month. Figure 2 shows a steady growth starting the second month after removal. Including outliers indicate that placing sea urchins on the second month might prevent the steady growth.Since June and March data points are omitted and trends change when outliers are included and excluded, data does not provide consistent trends.

DiscussionProblems with Data and Data Collection:Too many outliers– This can be mitigated with more data points. I had only one month to perform my research; I should have had at least 30 GPS points per month.No explanation for why May and June had high percent cover.June did not act as a control. Since both May and June had the highest standard deviations when all outliers were included, having more data points would determine a more accurate percent cover for one month and right after removal.Future projects can explore this project’s confounding variables:Effect of season on regrowth–use GPS points up to one year after removal to include all four seasons. Effect of distance from reef edge on regrowth– herbivorous fish, that might eat small pieces of Kappaphycus, often stay along the reef edge. Investigate why the first two months after removal have high percent cover using at least 30 GPS points per month.This project and future projects highlight the importance of federal marine invasive species regulatory laws. Kappaphycus now serves as the biggest threat to marine life in Kane‘ohe Bay; thus, defining methods that limit further growth of invasive species is a critical line of research in conservation biology.

AcknowledgmentsI would like to sincerely thank:Ily Iglesia, Kanoe Morishige, and Leilani Warren, the Marine Fellows of the Nature Conservancy in HonoluluBriana Tiffany, my research partnerSean Marrs, the Director of the Marine Fellowship ProgramDwayne Minton, the Marine Science Advisor at the Nature ConservancyJason Durnin, the leader of the SuperSucker CrewAnu Hittle, Director, Hawaiian Projects, Environmental StudiesDr. Tiffany Knight, Associate Professor in the WU Department of BiologyWU Environmental Studies ProgramWU Office of Undergraduate ResearchWU Career Center

Figure 1: Does not include outliers in February, March, April, and June. March has the highest standard deviation. A growth spurt starts on the fourth month after removal.

Figure 2: Includes all data points. May and June have the highest standard deviations. There is steady growth starting the second month after removal.

Divers feeding

Kappaphycus

into the

SuperSucker

The SuperSucker is connected to a boat where crew members package

Kappaphycus

into fertilizer

Kappaphycus

suffocating coral

Determining percent coverage of Kappaphycusat a GPS point using a quadrat

I snorkeled to all 60 GPS point