/
Fast Food Restaurants and Obesity in Schools Fast Food Restaurants and Obesity in Schools

Fast Food Restaurants and Obesity in Schools - PowerPoint Presentation

cheryl-pisano
cheryl-pisano . @cheryl-pisano
Follow
374 views
Uploaded On 2017-10-31

Fast Food Restaurants and Obesity in Schools - PPT Presentation

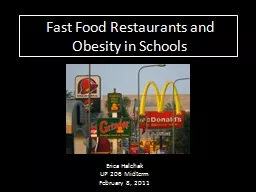
Erica Halchak UP 206 Midterm February 8 2011 The prevalence of obesity in Los Angeles schoolchildren is steadily on the rise In Los Angeles County 477 of children eat fast food at least once a week and 433 of children drink at least one soda or sweetened drink a day ID: 601222

fast food schools obesity food fast obesity schools monte school los angeles restaurants children county students obese created miles

Share:

Link:

Embed:

Download Presentation from below link

Download Presentation The PPT/PDF document "Fast Food Restaurants and Obesity in Sch..." is the property of its rightful owner. Permission is granted to download and print the materials on this web site for personal, non-commercial use only, and to display it on your personal computer provided you do not modify the materials and that you retain all copyright notices contained in the materials. By downloading content from our website, you accept the terms of this agreement.


Presentation Transcript

Slide1

Fast Food Restaurants and Obesity in Schools

Erica

Halchak

UP 206 Midterm

February 8, 2011Slide2

The prevalence of obesity in Los Angeles schoolchildren is steadily on the rise.

In Los Angeles County, 47.7% of children eat fast food at least once a week and 43.3% of children drink at least one soda or sweetened drink a day.

Only 27.4% of teens (age 14-17) consume five or more servings of fruits and vegetables a day.

Data from Los Angeles County Department of Public Health

Photo from:

http://www.stepsweightloss.com/wp-content/uploads/2010/03/obese-child.jpg

Slide3

In Los Angeles County, 22.9 % of children in grades 5, 7, and 9 are obese (BMI greater than the 95th

percentile) (LA DPH, 2007).Certain “hot spots” occur in the county, including South and East LA.

Created by Erica

Halchak

Los Angeles County Obesity RatesSlide4

28% of children in El Monte are obese.

Obesity rates in children are measured using Body Mass Index (BMI). For children ranging from ages 10-16 the “over the healthy” zone qualifies as gender specific BMI-for-age > 95

th

percentile.

Created by Erica

Halchak

El Monte Obesity Rates in SchoolsSlide5

Fast food restaurants close to school environments provide unhealthy but convenient choices for students.

Many restaurants are located within 0.5 miles from a school.In El Monte, 12 out of 33 schools have a fast food establishment within 0.5 miles of the campus.

Created by Erica

Halchak

El Monte Schools Proximity to Fast Food Slide6

High obesity is defined as more than 23% of students with BMI > 95th

percentile. Low obesity is defined as less than 23% of students with BMI > 95th

percentile.

23% was chosen because that is the average in Los Angeles County.

Of the 12 El Monte Schools that had a fast food establishment within 0.5 miles, 10 had high obesity (83.3%) .

Of the 21 El Monte Schools without a fast food establishment within 0.5 miles, 16 had high obesity (76.2%).

Created by Erica

Halchak

El Monte Schools Obesity Rates and Fast Food ProximitySlide7

Results:Does not appear to be a large difference between high obesity levels and having a fast food restaurant within 0.5 miles from school.

Future research:

Would like to use this metric for other cities around Los Angeles County to see if fast food restaurants tend to be located within 0.5 miles of a school.

Would like to look at the how socioeconomic status is related to obesity and fast food restaurant locations.

Would like to examine mode of transportation to and from school.

Sources: California Department of Education, UCLA Map Share,

SimplyMap

, Los Angeles Department of Public Health, El Monte Unified School District, Mountain View Unified School District. Slide8

Requirements used

Inset map. Point or line graduated symbol. Graduated symbol depicting obesity rates in school children in El Monte

Aggregating attribute fields.

Schools that had fast food restaurants within a half mile were selected and a new file was created. They were then coded as either over 23% of students were obese or less than 23% of students were obese. Then the schools that did not have a fast food restaurant within a half mile were also coded as either greater than or less than 23% of students obese.

Boundary sub-sets selections

El Monte file was created from Los Angeles Communities file.

Buffering.Half mile buffer added to depict how close fast food restaurants were to school.

Geocoding

Addresses for fast food restaurants and schools were

geocoded

then mapped.