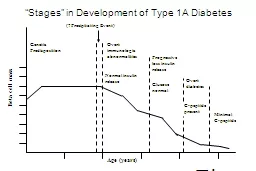
/
 “Stages” in Development of Type 1A Diabetes  “Stages” in Development of Type 1A Diabetes

“Stages” in Development of Type 1A Diabetes - PowerPoint Presentation

cheryl-pisano
cheryl-pisano . @cheryl-pisano
Follow
343 views
Uploaded On 2020-04-02

“Stages” in Development of Type 1A Diabetes - PPT Presentation

Age years Genetic Predisposition Beta cell mass Precipitating Event Overt immunologic abnormalities Normal insulin release Progressive loss insulin release Glucose normal Overt diabetes ID: 774709

diabetes risk high cell diabetes risk high cell insulin iaa age islet type category years abs 100 loss multiple

Share:

Link:

Embed:

Download Presentation from below link

Download Presentation The PPT/PDF document " “Stages” in Development of Type 1A ..." is the property of its rightful owner. Permission is granted to download and print the materials on this web site for personal, non-commercial use only, and to display it on your personal computer provided you do not modify the materials and that you retain all copyright notices contained in the materials. By downloading content from our website, you accept the terms of this agreement.


Presentation Transcript

Slide1

“Stages” in Development of Type 1A Diabetes

Age (years)

Genetic

Predisposition

Beta cell mass

(?Precipitating Event)

Overt

immunologic

abnormalities

Normal insulin

release

Progressive

loss insulin

release

Glucose

normal

Overt

diabetes

C-peptide

present

Minimal

C-peptide

Eisenbarth 2011

Slide2

TRIGGERING QUESTIONS

Is there an environmental trigger?

Does autoantibody appearance mark triggering?

Time lag between trigger and insulitis?

Time lag between insulitis and beta cell killing?

“Best Model”

?Kilham Rat Virus (Multiple Other viruses)

ACTIVATION INNATE IMMUNITY BY VIRUS

SPECIFIC MHC AND SPECIFIC TCR (Mordes et al)

ANTI-INFLAMMATORY PREVENTS (Zipris et al)

Slide3

Streptavidin

Coated plate

Sulfo

-TAG

Labeled Proinsulin

Biotin

Labeled Proinsulin

Insulin

Autoantibody

Yu et al Diabetes Nov 2011

Non-Radioactive

Electrochemiluminescent

Insulin Autoantibody Assay

Slide4

Progression to Diabetes Among Children Positive for Anti-Islet Autoantibodies

Steck et al Diabetes Care 2011

Slide5

Predicted Onset Age=2.6-1.3*log(mean IAA) =0.8* age first Ab+

Steck et al Diabetes Care 34:1397–1399, 2011

Slide6

R2=.37 P<.0001

Steck et al Diabetes Care 2011

Slide7

Steck et al Diabetes Care 2011

Slide8

R2=.47 p<.0001

Steck et al Diabetes Care 2011

Slide9

Progressive Loss C-peptide Post Diagnosis (SEARCH Diab Care 2009)

DCCT Fast>=.23ng/ml

Slide10

ACCELERATED LOSS OF PEAK C-PEPTIDE AFTER DIAGNOSIS OF TYPE 1A DIABETES (“WAITING” FOR CONFIRMATORY ORAL GLUCOSE TOLERANCE TEST)

Sosenko et al, Diabetes Care August 2008

Slide11

New Onset Type 1 DM: Loss of Insulin Secretion (ISR area(AUC)) related to early (peak<45 min) versus delayed secretion Mixed Meal

Steele et al Diabetes 53:26, 2004

Slide12

Type 1 diabetes risk stratification models based on islet autoantibody characteristics

Model 1

Model 2

Model 3

Model 4

Number of

islet autoantibodies

(IAA, IA-2A, GADA)

High titre of

IAA (>3rd quart.)

and IA-2A (>1st quart.)

High risk characteristics:

High titre IA-2A (>1st quart.)and IgG2 or IgG4 IA-2Aand IgG2, IgG3 or IgG4 IAA

Status ofIA-2A and IA-2βA

Category 1One autoantibody

Category 2Any twoautoantibodies

Category 3All threeautoantibodies

Stratification based on

Category 1Neither IAA nor IA-2Aat high titre

Category 2One of IAA or IA-2Aat high titre

Category 3Both of IAA and IA-2Aat high titre

Category 1No high riskcharacteristic

Category 2One high riskcharacteristic

Category 3Any two high riskcharacteristics

Category 4All three high riskcharacteristics

Category 1IA-2A negative

Category 2IA-2A positive andIA-2βA negative

Category 3IA-2AβA positive

Stratification based on

Stratification based on

Stratification based on

Shaded Categories: 10-year diabetes risk >50% (high-risk categories)

Achenbach et al., Diabetologia (2006) 49:2969-2976

Slide13

100

80

60

40

20

0

100

80

60

40

20

0

Diabetes-free survival (%)

Model 1

Model 2

Model 3

Model 4

Follow up (years)

P

= 0.02

P

< 0.001

P

< 0.001

P

< 0.001

P

= 0.02

2

4

6

8

10

0

12

2

4

6

8

10

0

12

2

4

6

8

10

0

12

2

4

6

8

10

0

12

Stable low-risk category

Changed from low-risk to high-risk category

Stable high-risk category

Changed from high-risk to low-risk category

Type 1 diabetes risk stratification considering changes in model risk category on follow-up

Achenbach et al., Diabetologia (2006) 49:2969-2976

Slide14

Sustained beta cell apoptosis in patients with long-standing type 1 diabetes: indirect evidence for islet regeneration?Meier et al, Diabetologia 2005

% Insulin/Pancreatic Area

Slide15

Time Course of Beta Cell Loss

Linear, Chronic ModelEisenbarth (NEJM 1986, 314:1360)

Benign:Malignant ModelLafferty (J Aut 1997, 10:261)

Random Loss ModelPalmer (Diabetes 1999, 48:170)

Age

Age

Beta

Cell

Mass

Beta

Cell

Mass

Age

Benign

Malignant

Beta

Cell

Mass

Slide16

Time Course Beta Cell Loss

Linear: Eisenbarth

NEJM 1986, 314:1360

Prodrome> Acute

Lafferty; J Aut 1997, 10:261

Random:Palmer

Diabetes 1999, 48:170

Slide17

LOSS OF FIRST PHASE INSULIN RESPONSE

TIME

Stages in Development of Type 1 Diabetes

BETA CELL MASS

DIABETES

“PRE”-DIABETES

GENETIC

PREDISPOSITION

INSULITIS

BETA CELL INJURY

NEWLY DIAGNOSED DIABETES

MULTIPLE ANTIBODY POSITIVE

GENETICALLY AT RISK

J. Skyler

Slide18

T1DM- a slowly progressive T-cell mediated autoimmune illness

Geneticsusceptibility

Islet

CellMass

100%

50%

0%

Inciting

Event(s)

“Brittle”

Diabetes

I

II

III

Time (years)

“Silent”

Cell Loss

We cannot easily/accurately measure islet mass in vivo or ex vivo

No accepted norm for the islet number within a human pancreas

Strong association with MHC class II (DQ in particular)

Other associations much weaker, population dependent-

e.g. insulin VNTR, CD152, other

Infectious agent(s)?- Etiology if true?

Environmental toxin(s)?

Absence of childhood illness?

Combination of factors?

Age of exposure?

Diabetes

Onset

cell

Mass??

Is

 cell mass

completely

lost?

Can

 cell

regeneration

occur?

Is

 cell loss

exclusively

immune mediated?

What is the “slope” of the

 cell loss?

Is recovery possible once process begins?

What underlies the effect of age on slope

of  cell loss?

Why does the  cell destruction typically

occur slowly (in contrast to graft rejection)?

David Harlan

Slide19

Diagnosis of Diabetes ADA

NORMALIMPAIREDDIABETESHbA1c<6.45.7-6.4>=6.5FASTING< 100 mg%(5.6 mM)100-125>= 126 mg%(7 mM)ORAL GTT<140 mg%(7.8 mM)140-199>=200 mg%(11.1 mM)

Diabetes Care 2004, 27: S5-S10

Slide20

Gestational Diabetes (>=2 high)100-g or 75-g Glucose

mg/dl

mmol/l

100-g Glucose

Fasting

95

5.3

1-h

180

10

2-h

155

8.6

3-h

140

7.8

75-g Glucose

Fsting

95

5.3

1-h

180

10

2-h

155

8.6

Slide21

“Stages” in Development of Type 1A Diabetes

Age (years)

Genetic

Predisposition

Beta cell mass

(?Precipitating Event)

Overt

immunologic

abnormalities

Normal insulin

release

Progressive

loss insulin

release

Glucose

normal

Overt

diabetes

C-peptide

present

No

C-peptide

Slide22

Age

Intravenous

Glucose

Tolerance Test (IVGTT) 1+3 minute insulin

Srikanta S. et al, New Engl J Med 308:322-325, 1983

Antibody Positive Initial Test

Antibody Positive

Discordant Triplets at Risk for Diabetes

0

50

100

150

200

250

300

350

14

16

18

20

21

22

24

27

30

34

35

36

37

38

40

42

43

44

45

46

47

48

49

50

14

15

16

17

18

19

20

21

22

23

DM

Slide23

“Biochemical” Autoantibody Assays

Insulin

Glutamic Acid Decarboxylase

ICA512 (IA-2)

Slide24

DPT-1 Ancillary Biochemical Ab

Cytoplasmic ICA Positive

(3.4%)

1/2 Negative for GAD/ICA512/Insulin Ab

0.9% = 1 Biochemical Ab

1.1% >=2 Ab

Cytoplasmic ICA Negative (96.6%)

3.3% =1 “Biochemcial Ab

0.3% >=2 Ab

Staging: Only 12% eligible ICA+/Bioch -

Future Trials Likely without ICA

Slide25

Progression to Diabetes vs Number of Autoantibodies

(GAD, ICA512, Insulin)

Percent not Diabetic

Years of Follow-up

3 Ab n = 41 17 8 1 2 Abs n = 44 27 15 4 2 1 1 Abs n = 93 23 14 10 6 4

Verge et al. Diabetes, 1996;45;926

Slide26

Gestational Diabetes: Risk at 2 years Type 1 Diabetes by AutoantibodiesICA, GAD65, ICA512(IA-2)

Sensitivity GAD=63%; Sensitivity 3 Abs=82%

Ziegler et al. Diabetes 1997: 46:1459-67, N=437

Slide27

LADA: Latent Autoimmune Diabetes Adults in UKPDS study

AGE

% GAD +

Insulin by 6 Years

Turner et al. Lancet 1997;350:1288-93

Slide28

Caveats of IVGTT Testing

Slide29

First-phase insulin release during the intravenous glucose tolerance test as a risk factor for type 1 diabetes (DPT)Chase et al. J. Peds 138,244; 2,001

<8 8-20 21-30 31-45

AGE

BDC

Slide30

FPIR in pre-diabetic relatives with initial FPIR > 50mU/L

Melbourne Pre-Diabetes Study (Colman PG & Harrison LC)

Slide31

Slide32

Insulin Secretion (IVGTT) in Obese Child (BMI 30 to 35) Progressing to Diabetes: Type 1 + Type 2 with Elevated Fasting Insulin

Slide33

Lack of Progression to DM of ICA+ 0602+ Relatives

Slide34

Slide35

Melbourne Data: Dual Parameter PredictionTime to DM=-.12+1.35ln(IVGTT)-.59ln(IAA)

<2.5 N= 11 5 3 1 0

>2.5 N=70 53 42 32 24 13 6

Proc AAP:110:126-135

Slide36

Normal but increasing hemoglobin A1c levels predict progression from islet autoimmunity to overt type 1 diabetes: Diabetes Autoimmunity Study in the Young (DAISY). Stene Pediatr Diabet 2005

DM

Slide37

Barker et al. DiabetesCare, 2004; 27:1399-1404.

Slide38

Diabetes Autoimmunity Study in the Young

Sibling/offspring cohort

General population cohort

enrolled = 293 high risk 72

429 moderate risk 220

347 average - low risk 401

1,069 All 693

relatives 1,491 1,007

screened = 21,713

Slide39

DAISY Interviews and Clinical

Interviews: diet infections immunizations allergies stress

B 3m 6m 9m 1y 15m 2y 3y

Clinical Visits: blood sample for GAA, IAA, ICA512, ICA

DNA

throat and rectal swabs

saliva sample

Visits

Slide40

Prediction of Autoantibody Positivity and Progression to Type 1 Diabetes: DAISY studyBarker et al. J Clin Endocrinol Metab 89:3896, 2004

Of 1,972= 8.2%

1/3

1/3

1/3

1/3 of Multiple Time+ are Transient (22/(22+24+28)

2/3 High Risk Diabetes

Slide41

Slide42

Relatives (SOC) vs. Population (NEC)Persistent vs. Transient AutoAb

Yu et al. JCEM 85: 2421, 2000

Slide43

PERCENT

Mature high-affinity immune responses to (pro)insulin anticipate the autoimmune cascade that leads to type 1 diabetes. Achenbach et al, J.Clin Invest 2004, 114:589

Slide44

Candidate environmental causes of type 1 diabetes

Definite (rare cases)

congenital rubella

Putative

enteroviruses

rotaviruses

components of infant diet

gluten

cow’s milk

Slide45

Enteroviruses: Recent Studies

Slide46

Autoantibody development and enteroviral RNA in a HLA-DR3/4,DQB1*0302 sibling

SD score

Age [yrs]

EV- EV+ EV- EV+ EV+ EV- EV+ EV+

EV- EV- EV-

DAISY ID 00060

ECHO 16

Slide47

Beta-cell autoimmunity and presence of enteroviral RNA in serum, saliva and stool Graves PM, DAISY, 1999

Prevalence of EV RNA

3/13

3/13

3/14

6/28

Slide48

DIPP Protocol

Main Cohort (n=38,000)

Newborns screened for genetic risk

High risk babies followed serially for ICA (n=81)

ICA-positive children randomized to nasal insulin or placebo

Slide49

Trials to Prevent Type 1 Diabetes

Trialnet/DPT-1

ENDIT

TRIGR

DIPP

Slide50

0

2

4

6

8

Age (years)

0

5

10

15

20

Cumulative Ab frequency (%)

DR3/4-DQ8

DR4/4-DQ8

Moderate

DR4-DQ8

Moderate DR3

Protective

Neutral

Development of islet autoantibodies in

1610 offspring of mothers or fathers with T1D

Walter et al, Diabetologia 2003 (updated 2004)

Slide51

Age (years)

Cumulative Ab frequency (%)

DR3/4-DQ8 or 4/4-DQ8+ INS VNTR I/I

Other

Development of islet Abs - HLA DR-DQ and INS VNTR genotypes

0

2

4

6

8

0

5

10

15

20

25

30

DR3/4-DQ8 or 4/4-DQ8

+ INS VNTR I/III or III/III

Walter et al, Diabetologia 2003 (updated 2004)

P

= 0.03

Slide52

0

2

4

6

8

0

5

10

15

20

25

30

Multiple autoantibodies (%)

both parents or

parent + sibling

mother only

father only

Age (years)

P

= 0.05

Development of islet Abs - proband

P

< 0.0001

A. Ziegler

Slide53

0

2

4

6

8

Time from first autoantibody positive (years)

0

20

40

60

80

100

Both parents or Parent plus sibling

Mother only

Father only

0

2

4

6

8

Type 1 diabetes (%)

0

20

40

60

80

100

High

Neutral or Protective

Moderate

HLA

Proband

Progression

from multiple islet Abs to diabetes

- No effect of HLA DR-DQ or proband

A. Ziegler

Slide54

0

2

4

6

8

10

0

2

4

6

8

10

Islet autoantibody appearance in BABYDIAB offspring

Age (years)

Any islet Abs (7.8%)

Multiple islet Abs (3.7%)

Single islet Abs

Hummel et al., Ann Intern Med, June 2004

A. Ziegler

Slide55

Time from first Ab (years)

Diabetes (%)

8

6

4

2

0

100

80

60

40

20

0

8

6

4

2

0

100

80

60

40

20

0

multiple antibodies

Single IAA

Hummel et al., Ann Intern Med, June 2004

Progression to multiple Abs is necessary for disease

A. Ziegler

Slide56

Progression

InsulinGADIA-2

A. Ziegler

Slide57

First antibody is insulin/proinsulin

10

8

6

4

2

0

8

6

4

2

0

IAA

IA2A

GADA

10

8

6

4

2

0

8

6

4

2

0

Age (years)

Cumulative frequency (%)

A. Ziegler

Slide58

104

105

106

107

108

1010

1011

IAA Affinity (L/mol)

109

1012

multiple

Abs

IAA

only

IAA affinity is high in children who develop

multiple islet Abs

P

<0.0001

Achenbach, J Clin Invest, 2004

A. Ziegler

Slide59

10

5

10

6

10

7

10

8

10

9

10

10

10

11

IAA Affinity (L/mol)

0

1

2

3

4

5

6

7

8

9

10

Age (years)

12

11

10

12

10

4

IAA affinity is relatively stable during follow-up

A. Ziegler

Slide60

100

80

60

40

20

0

% with multiple islet abs

0

2

1

4

3

Progression to multiple islet autoantibodies

in children is related to IAA affinity

IAA affinity high

IAA affinity low

P

= 0.0004

IAA positive follow-up (years)

A. Ziegler

Slide61

Risk for developing islet Abs in relation to birth autoantibody status in offspring of T1D mothers

10

8

6

4

2

0

10

8

6

4

2

% with multiple Abs

Age (years)

POS GADA or IA2A at birth

n = 476

NEG GADA and IA2A at birth

n = 244

P = 0.007

Koczwara et al, Diabetes 2004

Father T1D

A. Ziegler

Slide62