/
Using an Intelligent Tutoring System to increase parental Using an Intelligent Tutoring System to increase parental

Using an Intelligent Tutoring System to increase parental - PowerPoint Presentation

cheryl-pisano
cheryl-pisano . @cheryl-pisano
Follow
342 views
Uploaded On 2019-06-29

Using an Intelligent Tutoring System to increase parental - PPT Presentation

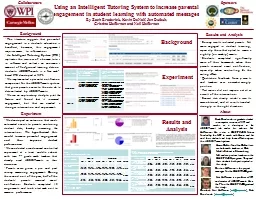
engagement in student learning with automated messages By Zach Broderick Kevin DeNolf Jen Dufault Cristina Heffernan and Neil Heffernan Experiment The literature suggests that parental engagement ID: 760614

student unit students assignments unit student assignments students parents engagement assistments heffernan homework survey performance teachers 1unit system experiment

Share:

Link:

Embed:

Download Presentation from below link

Download Presentation The PPT/PDF document "Using an Intelligent Tutoring System to ..." is the property of its rightful owner. Permission is granted to download and print the materials on this web site for personal, non-commercial use only, and to display it on your personal computer provided you do not modify the materials and that you retain all copyright notices contained in the materials. By downloading content from our website, you accept the terms of this agreement.


Presentation Transcript

Slide1

Using an Intelligent Tutoring System to increase parental engagement in student learning with automated messagesBy Zach Broderick, Kevin DeNolf, Jen Dufault, Cristina Heffernan and Neil Heffernan

Experiment

The literature suggests that

parental engagement

in a student’s education is beneficial; however, this engagement requires access to information.

An

Intelligent Tutoring System (ITS)

replicates the services of a human tutor in software and collects an enormous amount of fine-grained learning data on students. ASSISTments is a free web-based ITS developed at WPI.We implemented a parental notification component for the ASSISTments system that gives parents access to the valuable data collected by ASSISTments.We ran an exploratory study to pilot the feature and found that it increased engagement, but that we needed a stronger intervention and experiment.

Background

Results and Analysis

Collaborators

Sponsors

About

We developed an extension that sends automated emails to parents containing student data, thereby increasing the intervention.

We hypothesized this would increase parental engagement and thus improve student performance.

We conducted a randomized controlled experiment at a local middle school with two 7

th

grade math teachers that already used

ASSISTments

in their classroom.

Parents were given a pre and post survey measuring engagement. During the second unit of the year, half of the students’ parents received email notification. Students completed 15 assignments and took a test each unit to measure performance.

Zach Broderick is a graduate student

in computer science at WPI and

works as a developer in the

ASSISTment lab under his advisor Neil Heffernan. He is also a GK12/PIMSE fellow funded by the NSF to work with Kevin and Jen and their students and help them effectively use the ASSISTment system. Kevin DeNolf and Jen Dufault are are both math teachers at Oak Middle School in Shrewsbury, MA and are partner teachers in the GK12/PIMSE program. They and their students both participated in this study. Cristina Heffernan is the project manager for the GK12/PIMSE grant. Neil Heffernan is a professor at WPI and creator of ASSISTments. He is the PI on the GK12/PIMSE grant and this study.Contact: Neil Heffernan (nth@wpi.edu), Zach Broderick (zbrod@wpi.edu)

Survey results indicated parents felt more engaged in student learning, especially those that opted to receive nightly (vs. weekly) emails.Students completed significantly more of their homework when their parents received email notification, especially when controlling for the ceiling effect.Qualitative feedback from parents and teachers was overwhelmingly positive.Test scores did not improve at all as a result of the intervention.Several statistically reliable results were obtained, and all results trended strongly in the right direction.

Experiment

Local middle school

Two

ASSISTment

teachers

7

th

grade math4 classes/teacher, 20 students/classStudents assigned to condition by going through roster alphabeticallyTwo units, 15 assignments and 1 test eachIntervention during 2nd unit for exp. groupConditionUnit 1Unit 2ExperimentStudents complete 15 homework assignments on ASSISTments.Students are given unit testParents are not yet involvedParents are given pre-survey to measure engagementParents are invited to sign up for accounts on ASSISTmentsParents receive automated messages from the system throughout the unitStudents complete 15 homework assignments on ASSISTmentsStudents are given unit testParents are given post-surveyControlStudents complete 15 homework assignments on ASSISTments.Students are given unit testParents are not involvedParents are given pre-survey to measure engagementParents are NOT given accounts and do NOT receive automated messagesStudents complete 15 homework assignments on ASSISTmentsStudents are given unit testParents are given post-survey

Table 5.2Parent responses to survey questions on engagement (who received nightly emails)Scaled 1-5, 1=Strongly Disagree, 5=Strongly AgreeSurvey QuestionControlExperiment Unit 1Unit 2GainUnit 1Unit 2Gain∆GainI feel I have a good understanding of what is going on in my student’s math class.3.47(0.94)3.94(0.83)0.47(0.87)3.14(1.07)4.00(0.82)0.86(1.07)0.39I feel I have a good understanding of how my student is performing in math class.3.88(0.99)4.29(0.92)0.41(0.94)3.43(1.13)4.14(0.38)0.71(0.95)0.30I feel I am being provided enough information about my student's performance.4.00(1.06)4.18(0.81)0.18(1.01)4.00(0.58)4.14(0.69)0.14(0.38)-0.03I check to make sure my student has completed their homework at night.3.59(1.00)3.24(1.30)-0.35(1.73)3.29(1.70)4.43(0.79)1.14(1.21)1.50aI closely monitor my student's performance (as in, check grades on assignments and tests)4.29(0.92)4.06(1.03)-0.24(1.35)4.71(0.49)4.71(0.49)0.00(0.00)0.24Standard deviations are noted in parentheses.N = 24; N(Control) = 17, N(Exp) = 7ap < 0.05, Effect Size=0.95

Table 5.5Student performance data (Teacher J only)Performance MetricControlExperiment Unit 1Unit 2GainUnit 1Unit 2Gain∆GainAvg percent of assignments completed91.14(13.87)92.57(13.82)1.43(12.84)89.53(12.75)96.84(6.88)7.30(12.22)5.87aAvg percent of assignments completed on time84.24(13.95)81.64(17.16)-2.60(15.18)81.56(14.65)87.00(15.76)5.44(15.80)8.04bAvg unit test score3.29(0.78)3.26(0.69)-0.02(0.63)3.34(0.54)3.22(0.67)-0.12(0.64)-0.09Standard deviations are noted in parentheses.N = 85ap < 0.05, Effect Size=0.46bp < 0.05, Effect Size=0.53

Background

Experiment

Results and

Analysis