/
An  exploratory analysis of rail travel time and fare diffe An  exploratory analysis of rail travel time and fare diffe

An exploratory analysis of rail travel time and fare diffe - PowerPoint Presentation

conchita-marotz
conchita-marotz . @conchita-marotz
Follow
423 views
Uploaded On 2016-07-12

An exploratory analysis of rail travel time and fare diffe - PPT Presentation

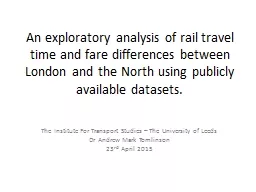
publicly available datasets The Institute For Transport Studies The University of Leeds Dr Andrew Mark Tomlinson 23 rd April 2015 Class 87 at Crewe April 1977 3 x Class 86s at Preston April 1977 ID: 401711

fares london rail model london fares model rail time north data fare station atoc distance minutes stations standard std

Share:

Link:

Embed:

Download Presentation from below link

Download Presentation The PPT/PDF document "An exploratory analysis of rail travel ..." is the property of its rightful owner. Permission is granted to download and print the materials on this web site for personal, non-commercial use only, and to display it on your personal computer provided you do not modify the materials and that you retain all copyright notices contained in the materials. By downloading content from our website, you accept the terms of this agreement.


Presentation Transcript

Slide1

An exploratory analysis of rail travel time and fare differences between London and the North using publicly available datasets.

The Institute For Transport Studies – The University of Leeds

Dr Andrew Mark Tomlinson

23

rd

April 2015Slide2

Class 87 at Crewe, April 1977

3 x Class 86’s at Preston, April 1977

Class 08

shunter

waiting for work at Preston, April 1977Slide3

Presentation AimsTo introduce and raise awareness of two useful rail datasets

To outline the content of the datasets and the difficulties associated with using them

To demonstrate the use of the datasets in an example problem

To report on leading edge researchSlide4

Station Usage DataShows Passenger Entries/Exits/Interchanges

Differentiates between Peak, Off-Peak and Seasons

1997 onwards

http

://orr.gov.uk/statistics/published-stats/station-usage-estimatesExcel format, with notes on methodology

Better estimate of total passenger trips compared to ORR headline figure (1332.5M vs 1600M)

Leeds Station: Total Entries 1998 - 2014 Slide5

UK Centres of Gravity(using rail station usage data)

UK Population

Rail Station

Rail Passengers

Median Method:

Number North=Number South & Number West=Number EastSlide6

UK Population: Centre of Gravity

(

Polesworth

)

UK Rail Station: Centre of Gravity

(Olton)Slide7

UK Rail Passengers: Centre of Gravity

(London Paddington)

UK Rail Passengers: Centre of Gravity

(London

Marylebone

)Slide8

How does the daily commute differ between London and the North?Fare Paid

Journey Time

Examined using publicly available datasets:

ATOC Timetable Data

ATOC Fares DataSlide9

Timetable DatasetUK timetable available in electronic form from ATOC

(

http

://data.atoc.org/how-to

)Text based fixed format files defined according to CIF End User Specification (www.atoc.org/clientfiles/files/RSPDocuments/20070801.pdf) Stations (nodes)

identified by CRS (3-letter) code and TIPLOC (timing point location)geocoded to within 500m using Easting/Northing pairServices (links)Header record:

validity, days of operation, head-code, power-type, speed, class, TOCDetails records (one per pair of adjacent stations):Arrival/departure times, allowances, special instructions/activities

ProblemsMissing interchange times for large stations?Stations + Service records create a 3 dimensional network (x, y, and time).

Traversing this network yields all routes and timings between two pointsSlide10

Timetable Dataset Example

Service

Header

Service

UID

Y52133From14/12/2014

To10/05/2015Days Run0000001

Head-code2M63

Power TypeDMUSpeed

075

Timing

Load

A

Train

Class

S

TOC (X

Header)

NT

StationArriveDepartHUD10:15

SWT

10:22

10:22

MSN

10:27

10:28

GFD

10:36

10:36

MSL

10:41

10:41

SWT

10:45

10:46

AHN

10:50

10:50

MCV

11:04

2,953 station records,

70,166 train service headers (period December 2014 – May 2015)

837,007 train service movements (between pairs of stations)Slide11

Fares DatasetAll UK rail fares available in electronic form from ATOC

Text based fixed format files

Uses a mix of CRS and NLC codes to identify locations

Comprehensive description of each table and

field available (http://data.atoc.org/sites/all/themes/atoc/files/SP0035.pdf) Split into standard fares and non-derivable, TOC specific and Advance purchase fares

Useful other information: restrictions, discounts, rounding, rail cards, rovers, supplementsProblemsDataset very largestandard fares alone can be imported into Access

Importing other fares cause Access 2GB limit to be exceededNo information about how to query the dataReverse engineering + ValidationStandalone Advantix Traveller application also available (much faster than the web)Slide12

Finding a Fare

Origin

Destination

CRS: HUD

NLC: 8437

CRS: LDS

NLC: 8487

One-way fare

Two-way fare

Station

Cluster

Station

Cluster

+ Group Stations (Bradford Stations)

+ Ticket Type: return/single, anytime/off-peak, first/standard

+ Route + Restrictions: Via / Not Via, Valid / Not ValidSlide13

Avantix Standalone ApplicationSlide14

Four Northern Cities

Leeds: WYPTE - LDS

Sheffield: SYPTE - SHF

Manchester: GMPTE - MAN

Liverpool: MPTE - LIV

London:

TfL

- LONSlide15

Model Specification(s)

Attribute

Value

Model Type

Linear

(OLS)

2 x Models

Destination LDS + MAN + SHF + LIV

Destination LON

2 x Dependant variables

One way fare to centre, £ (Anytime day return/2)

Travel Time to centre, minutes (including

waiting time)

Independent variables

Variable

A (Fare)

Variable B (Time)

Model 1

Model 2

Models 1 + 2

Cartesian

Distance (km)

Is Not in PTE (Dummy)

Is City X (dummy)

Cartesian

Distance (km)

Cartesian

Distance (km)

Is Not Direct (Dummy)

Filter

Origin >5 km, Not HS1

station, Journey Time < 90 minutes, Day Return

Data Points

LON: 427,

LDS: 119, LIV: 177, MAN: 228, SHF: 111Slide16

Results Model A (Fare)Fares increase (almost) linearly with distance

Access charge becomes less significant as distance increases

Fares within the ‘home’ PTE region cheaper than those outside PTE region

Model 1 (North)

Model 2 (London)

n

635

427Adjusted

R20.80

0.84

Standard Error

1.04

1.32

B

Std.

Err

B

Std. Err

Constant:

Access Charge (£)1.010.1051.000.137Distance (£/km)0.12**

0.005

0.25**

0.005

Not in PTE (£)

1.37**

0.126

Is MAN (£)

0.44**

0.087Slide17

Results Model B (Travel Time) Fit not that good

Travel time increases (approximately) linearly with distance

Overall journey times are shorter in London

Impact of changes more significant in North

Model 1 (North)

Model 2 (London)

n635

427

Adjusted R20.69

0.55 !

Standard Error

10.7

8.5

B

Std.

Err

B

Std. Err

Constant (minutes)

8.451.0211.820.88Distance (minutes/km)1.11**

0.04

0.78**

0.03

Change

needed (minutes)

6.73**

0.98

1.56

0.96Slide18

What proportion of fares difference can be attributed to time savings?

Model rephrased to include Value of Journey time @ £6.81/hour (commuting VOT, 2014)

Difference suggests that time saving benefits represent 25%-30% of fare premium paid by Londoners

Some value could also be attached to other quality attributes (The Hated Pacers!)

Model 1 (North)

Model 2 (London)

n635

427

Adjusted R20.79

0.84

Standard Error

2.14

1.82

B

Std.

Err

B

Std. Err

Constant (£)

2.140.2172.470.188Distance (£/km)0.26**

0.01

0.35**

0.007

Not in PTE (£)

2.28**

0.26Slide19

London vs North

Attribute

Winner

Notes

Journey

TimesLondon (≈ 20km/h faster)Effect of Changing

TrainsLondon (fewer and less disruptive)London: 103 (24%) average wait 7.2 minutesNorth: 238 (38%)

average wait 12.6 minutesFaresNorth

(≈ £0.12/km cheaper)VOT benefits account for 25% of difference

Fare Boundaries

London (fewer/none)

PTE boundaries create artificial

barriers, impose financial penalty on cross boundary travel (compare with VRR in Germany)

Day Return Tickets

London (available

from all origins)

London: 427 (99.8%) out of 428

North: 635 (91.2%) out of 696

Thirsk-Leeds, Preston-ManchesterLonger Distance CommutingLondonLimited opportunities for commuting from >50km in NorthSlide20

Further UsesTo create a repository of all timetables and fares data going forwardTo study evolving service patterns in order to write a narrative around the changing nature of passenger rail travel/industry

Combine:

fares, timetable and station entry/exit data

population and employment data

To reverse engineer/synthesise a public OD trip matrixSlide21

How does the cost of car commuting compare to rail ?

AA (July 2014), ‘Average’ Petrol car

Fixed costs £3,678

Running costs £0.13/km (@ £1.09/litre)

Commuting assumed 5 days/week for 46 weeks/yearExcludes parking costs and values of difference in journey timeSlide22

How does the cost of car commuting compare to rail ?Rail cheaper than car when fixed costs are included

Discounts on Season tickets would make fares almost equivalent to running costs only

Assumes Single Occupancy Vehicle (SOV)