/
Exhibit Exhibit

Exhibit - PowerPoint Presentation

conchita-marotz
conchita-marotz . @conchita-marotz
Follow
377 views
Uploaded On 2017-11-10

Exhibit - PPT Presentation

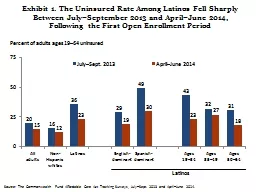
1 The Uninsured Rate Among Latinos Fell Sharply Between JulySeptember 2013 and AprilJune 2014 Following the First Open Enrollment Period Percent of adults ages 1964 uninsured Source ID: 604358

marketplace latinos plan 2014 latinos marketplace 2014 plan june medicaid affordable health percent uninsured april

Share:

Link:

Embed:

Download Presentation from below link

Download Presentation The PPT/PDF document "Exhibit" is the property of its rightful owner. Permission is granted to download and print the materials on this web site for personal, non-commercial use only, and to display it on your personal computer provided you do not modify the materials and that you retain all copyright notices contained in the materials. By downloading content from our website, you accept the terms of this agreement.


Presentation Transcript

Slide1

Exhibit 1. The Uninsured Rate Among Latinos Fell Sharply Between July–September 2013 and April–June 2014, Following the First Open Enrollment Period

Percent

of adults ages 19–64 uninsured

Source: The Commonwealth Fund Affordable Care Act Tracking Surveys, July–Sept. 2013 and April–June 2014.

LatinosSlide2

Exhibit 2. The Greatest Decline in the Uninsured Was Among Latinos with Low Incomes; One-Third of Latinos Remained Uninsured in States That Did Not Expand Medicaid

Percent of Latino adults ages 19–64 uninsured

Notes: FPL refers to federal poverty level.

The April–June 2014 sample

of Latinos with incomes 400 percent of poverty or more is small, n=76. Expanded

Medicaid:

States that began enrolling individuals in Medicaid in April

2014 or

earlier,

including

AR, AZ, CA, CO, CT, DE, HI, IA, IL, KY, MA, MD, MI, MN, ND, NJ, NM, NV, NY, OH, OR, RI, VT, WA, WV, and the District of Columbia.

All

other states were

considered

as not expanding.

Source: The Commonwealth Fund Affordable Care Act Tracking Surveys,

July–Sept

. 2013 and

April–June

2014. Slide3

Exhibit 3. Latino Adults Who Were Potentially Eligible for Coverage Were Less Likely Than Potentially Eligible Non-Hispanic Whites to Have Visited a Marketplace by the End of Open Enrollment

Percent “Yes”

* Foreign-born, but U.S. citizen or permanent resident

. Sample size for foreign-born Latinos potentially eligible for coverage was small, n=97. Source: The Commonwealth Fund Affordable Care Act Tracking

Survey, April–June 2014.

Adults

ages 19–64 who are uninsured or have individual

coverage

Have you gone to this new marketplace to shop for health insurance?

This could be by mail, in person, by phone, or on the Internet.

LatinosSlide4

Exhibit 4. Latinos Who Visited the Marketplace

Found It Easy to Find a Plan

They Could Afford and a Plan with the

Type of Coverage They NeededPercent a

dults ages 19–64 who went to marketplace

Note:

Bars

may not sum to 100 percent because of “don’t know” responses or refusal to respond; segments may not sum to subtotals because of rounding

.

Source

:

The Commonwealth Fund Affordable Care Act Tracking

Survey, April–June

2014.

How easy or difficult was it to

find . . .?

46

43

50

54

A plan with the type of coverage you need

A plan you

could afford

Somewhat easy

Very easy

Somewhat difficult

Very difficult or impossible

53

42

38

59

54

58

45

37Slide5

Percent adults ages 19–64 who went to marketplaceExhibit 5

. When They Visited the Marketplace, Latinos Were More Likely

Than Non-Hispanic Whites to Select a Health Plan or Enroll in Medicaid

Did you select a private health plan or enroll in Medicaid through the marketplace?

Note: Bars may not sum to 100 because of “don’t know” responses and refusals; segments may not sum to indicated total because of rounding. This question was only asked of those individuals who said they had visited a marketplace. More people may have enrolled in coverage through Medicaid or a qualified health plan

outside of the marketplace.

Source

:

The Commonwealth Fund Affordable Care Act Tracking Survey,

April–June

2014.

51

66

47

Did not select a

private plan or

enroll in Medicaid

Enrolled in

Medicaid

Selected a private

health plan

Selected a plan,

but not sure if

private or MedicaidSlide6

Exhibit 6. Nearly Seven of 10 Latino New Enrollees Were Previously Uninsured Adults ages 19–64 who selected a private plan or enrolled in Medicaid through marketplace or have had Medicaid for less than 1 year

Percent

Source: The Commonwealth Fund Affordable Care Act Tracking

Survey, April–June 2014.What type of health insurance did you have prior to getting your new coverage? Slide7

50–6419%19–3440%

35–4940%

Exhibit 7. At the End of Open Enrollment, Two of Five

Remaining Uninsured Latinos Were Under Age 35 and Almost All Were Low-IncomeAge

Citizenship status

Notes: FPL refers to federal poverty

level. Segments

may not sum to 100 percent because of

rounding.

Source

:

The Commonwealth Fund Affordable Care Act Tracking

Survey, April–June

2014.

Income

<138% FPL

60%

138%–399% FPL

39%

400% FPL or more

1

%

Foreign-born,

not U.S. citizen

or permanent resident

16%

U.S.-born

35%

Foreign-born, U.S. citizen or permanent resident46%

Refused3%

Uninsured Latinos ages 19 to 64

Refused

1%Slide8

Exhibit 8. Awareness of the Marketplace Increased During Open Enrollment But Still Lags Among Spanish-Dominant Latinos Who Are Potentially Eligible for New Coverage Under

Health Reform

Since the beginning of October, under the health reform law, also known as the Affordable Care Act, new marketplaces have been open in each state where people who do not have affordable health insurance through a job can shop and sign up for health insurance.

Are you aware of this new marketplace in your state? Adults ages 19–64 who are uninsured or have individual coverage

Notes: FPL refers to federal poverty level. The question wording differed somewhat between the

July–September 2013 and April–June 2014 surveys.

Source

: The Commonwealth Fund Affordable Care Act Tracking Surveys, July-Sept.

2013 and April-June 2014.

Latinos

Percent “Yes”