/
Genetic and shared environmental influences on brain develo Genetic and shared environmental influences on brain develo

Genetic and shared environmental influences on brain develo - PowerPoint Presentation

conchita-marotz
conchita-marotz . @conchita-marotz
Follow
436 views
Uploaded On 2016-05-04

Genetic and shared environmental influences on brain develo - PPT Presentation

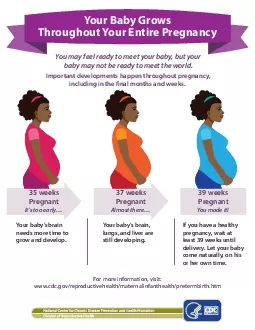
Timothy C Bates University of Edinburgh Mike Neale Virginia Institute of Psychiatric Genetics John Gilmore University of North Carolina Foetal brain Illustration by Helen Spiers Brain development and growth ID: 305916

genetic brain matter amp brain genetic amp matter time environment volumes development ses white gray age model years growth

Share:

Link:

Embed:

Download Presentation from below link

Download Presentation The PPT/PDF document "Genetic and shared environmental influen..." is the property of its rightful owner. Permission is granted to download and print the materials on this web site for personal, non-commercial use only, and to display it on your personal computer provided you do not modify the materials and that you retain all copyright notices contained in the materials. By downloading content from our website, you accept the terms of this agreement.


Presentation Transcript

Slide1

Genetic and shared environmental influences on brain development from birth to age 2-years

Timothy C. Bates

University of Edinburgh

Mike Neale

Virginia Institute of Psychiatric Genetics

John Gilmore

University of North CarolinaSlide2

Foetal brain…

Illustration by Helen

SpiersSlide3

Brain development and growth

Single most important biological marker for

cognition

(McDaniel

, 2005

)

Linked to psychiatric

outcomes

including

schizophrenia

(Steen

, Mull,

Mcclure

,

Hamer

, & Lieberman, 2006

)Slide4

Lifetime consequence, early growth

Much of this critical growth occurs in the earliest years of life

C

ortical gray matter more than doubles in the first year

(Gilmore et al., 2012).

Influences known from adult studies

Parental social and economic status (SES)

(Hackman & Farah, 2009

).Slide5

Logarithmic link of cortical volume to SES (Noble et al. 2015)Slide6

Forbes magazineSlide7

©

Roslin

Institute

Common ancestor ~100 generations ago (h

2

growth ~ 0.3)

However:

Genes can effect biological volumes…Slide8

However…

Brain volumes are a highly heritable

endophenotype

Blokland

, de

Zubicaray

, McMahon, & Wright, 2012

Morphology & psychological function genetic correlated

Posthuma

et al., 2002.

Specific genetic variants identified influencing structural volumes

Hibar

et al., 2015;

Ikram

et al., 2012.Slide9

Genes found for specific brain regional volumesSlide10

Genetic or Environmental?

No studies have combined genetic and neurological examination in infancySlide11

Prior data

Knowledge largely from studies of adults and children

Nature and number of

influences during earliest

years of infant brain

development

virtually unknown (Gilmore et al., 2012

)

Potential

interaction effects with SES in the expression of genetic potential

untestedSlide12

Unique infant twin sample

Assessed longitudinally from shortly after birth through age-2 in three consecutive waves of brain imaging

Characterized on family environment.

285 infants

174 DZ (87 pairs)

106 MZ (53 pairs)Slide13

Landmark studies from 4-20 years(Geed et al., 1999)

Large increases in gray and white matter from ages 4- thru 20-years

G

ray matter volumes similarly increasing until a period of volume-reduction initiating at adolescence

Giedd et al. ( 1999)

These studies also showed the importance of temporal patterning per se

IQ

is associated with cortical thickness in 6 to 11 year olds (

Karama

et al., 2009)

but also

Complex and non-linear pattern of prolonged cortical thickening (Shaw et al., 2006). Slide14

Cortical thickness linked to IQShaw

et al. (2006)Slide15

Plasticity higher in high-IQ kids

Shaw

(2006

)Slide16

Shaw (2006): Higher IQ association with delay growth, and extended pruningSlide17

Prior to age-4

Much less is known about the nature and time course of brain development.

Heritabilities surprisingly high early in life.

Note: studies of IQ indicate much

lower

heritability in children compared to adults

(Haworth et al., 2010

)Slide18

Neonate heritabilities

Analyses of the neonatal wave of the present sample indicated heritability values only slightly lower than those found in child samples

h

2

of .73 and .85 for total intracranial and white matter volumes respectively

(Gilmore et al., 2010).

Period from birth to age 2 is associated both with rapid increases in gray and white matter volumes and, in one study, with the emergence of gene × environment interaction

(Tucker-

Drob

,

Rhemtulla

, Harden,

Turkheimer

, &

Fask

, 2011)Potential for complex interactions, and multiple genetic and environmental factors across time or operating at one, but not other developmental windows.Slide19

Present Study Initial Steps

Characterise

Genetic

and environmental factors influencing whole-brain volumetric

development

D

erived

separately for gray and for white matter

N

eonatal

, and 1- and 2-years of age

Testing:

Continuities

discontinuities

modes

of operationincluding gene environment interactions.Slide20

Subjects

This paper reports on subjects taking part in the large, prospective study of early brain

development

(Gilmore

et al.,

2010).

Subjects

were recruited prenatally and scanned shortly after birth, and at ages 1 and 2

years.

Also

assessed with the Mullen Scales of Early Learning (Mullen, 1995) at ages 1 and 2

years.

Neonates

were scanned at a median age of 35 days (range 9 and 161 days). Year 1 scans took place at a median age of 402 days (min 351, max 511), and year 2 follow-up scans at 770 days (min 661, max 879

).Slide21

Method

MRI scans were performed on a Siemens 3T head-only scanner (Allegra, Siemens Medical System, Erlangen, Germany

).

The

infants were not sedated, were fed before scanning, and given ear

protection.

To

reduce movement artifact, the head was aligned in using a weak

vacuum-cup.

A

nurse was present during all

scans

Heart

rate and oxygen saturation were monitored with a pulse oximeter

.Slide22

Scans

T1-weighted structural pulse sequences were a 3D magnetization prepared rapid gradient echo (MP- RAGE time repetition [TR] = 1820

ms

, inversion time = 1100

ms

, echo time = 4.38

ms

, flip angle = 7°, and n = 144

).

Proton

density and T2-weighted images were obtained with a turbo spin echo sequence (TR = 6200

ms

, time echo [TE]1 = 20

ms

, TE2 = 119

ms, and flip angle 150°).Spatial resolution was 1 × 1 × 1-mm voxel for T1-weighted images, 1.25 × 1.25 × 1.5-mm voxel with 0.5-mm inter-slice gap for proton density/T2-weight images.For children who failed or were deemed likely to fail due to difficulty sleeping, a ‘fast’’ sequence was done; 12 neonates had a ‘‘fast’’ T2 scan with a decreased TR, image matrix and number of slices (5270 ms, 104 3 256 mm, 50) and 3 one year olds had a ‘‘fast’’ T1 scan with a decreased image matrix (144 3 256 mm).A clinical radiologist evaluated all scans; no gross abnormalities were reported.Slide23

Quantization

Pre-processing

A

daptive

fuzzy c-means automatic brain tissue segmentation method was performed to correct intensity inhomogeneity (Pham & Prince, 1999).

Volumes

of white and gray matter were quantitated

automatically

A

tlas-moderated

iterative expectation maximization segmentation algorithm followed by

parcellation

achieved by nonlinear

warping (Gilmore

et al., 2007

)Subject-specific tissue probabilistic maps.Maximize precision and longitudinally consistency of segmentation resultsParcels aggregated to form whole-brain volume vectors for analysis.Slide24

Mapping and Segmentation

Gray and white matter (GM and WM respectively), and cerebrospinal fluid (CSF) maps in 2-year olds were used as probabilistic atlases to guide segmentation of 2-week-old and 1-year-old images of the same subject using an iterative, simultaneous, registration and segmentation framework.

(Gilmore et al., 2012; Shi et al., 2011).

Based on this 4D segmentation and registration algorithm, GM and WM volumes at were extracted from 90 regions identified at each age.

T1 images were used for 1 and 2 year olds and T2 images for neonates.Slide25

Present Study: Hypotheses

Characterise

Genetic

and environmental factors influencing whole-brain volumetric

development

D

erived

separately for gray and for white matter

N

eonatal

, and 1- and 2-years of age

Testing:

Continuities

discontinuities

modes

of operationincluding gene environment interactions.Slide26

Heritability across time

The heritability of

volumes may

alter with

time.

H

eritability

of

IQ increased from

childhood into old age

(

Deary

,

Spinath

, & Bates, 2006)

But… heritability of gray & white matter volumes high in neonates (Gilmore et al., 2012)Prediction 1: Heritability at 1 & 2 should exceed that found in neonates.Contrasting model: Unlike IQ gray and white matter volumes always under strong genetic influenceSlide27

Shared environments:

Magnitude

and

trajectory

Existing

theories make strongly contrasting

predictions

Model 1: Large

role of shared environment

Model 2: Model 1: Mostly geneticSlide28

Model 1: Large role of shared environment

Large

role of shared environment on IQ scores prior to

school

Olson

et al., 2014;

Tucker-

Drob

et al.,

2011

SES implicated in brain

development

Noble

& Farah,

2013Predict C increasing with time (and exposure to the rate-limiting environment)Slide29

Model 2: Model 1: Mostly genetic

Very high heritability suggests little room for shared environment

Familial influences on brain development may be confounding genetic effects.

Contrasting prediction: minimal shared environment at all three waves.Slide30

Developmental Hypotheses: Almost nothing is known

Number

of

genetic

and environmental factors impacting brain development over this

period

Time-course

Increasing

Decreasing

L

imited

to a single

ages

Compensatory

reversals of effect over time

.Slide31

One common genetic factor

The generalist genes model of cognitive

ability

(

Kovas

& Plomin,

2006)

Relative

lack of genetic innovation in intelligence from pre-school to the

teens

(Bartels

,

Rietveld

, Van Baal, & Boomsma,

2002)Predict that this heritable component will be carried by a single vector.Slide32

Alternative hypothesis:Multiple factors:

Unclear

how brain development is impacted by the genome during these early periods of rapid

growth:

genes

act

(

albeit with diverse mechanisms) so as to exert a monolithic

effect

two

, three, or more distinct patterns, some with time-limited influence.

Predict

: General

influences

AND

time-delimited or gray-white matter specific actions. Slide33

Longitudinal impact of family environment

Simplest

model

suggests

a single family environment

factor

S

ignificant

and constant influence on gray and white matter

volumes

Perhaps

declining in influence with time

.Slide34

Canalization model of volume growth

Distinct predictions emerge from models in which brain development is tightly canalized

internal programs causing brain to remain on a programmed course

Able to recover from external shocks or stresses to regain this programmed trajectory via compensatory control mechanisms

(

Giedd

et al., 1999; Gilmore et al., 2010).

Applied to brain development suggests that environmental influences should be impact brain volume, but that these should decay and be reversed.Slide35

Impact of Shared environment reversed by canalized growth program

F

amilial environmental effects compensated (reversed) by canalization processes

Waddington, 1957

Quantitatively, this would manifest as a factor strongly loading on shared environment, and showing sign-reversal between its neonatal and year 1 and 2 loadingsSlide36

4 Pathways to Brain GrowthSlide37

Factor 1: largely CSlide38

Factor 3: Largely ASlide39

Factor 2: A+ESlide40

Factor 4: A+CSlide41

4-factors over time…Slide42

4 Pathways to Brain GrowthSlide43

Time CourseSlide44

Putting it all together longitudinallySlide45

Interactions: Gene x SESA main effect model (Bates et al, 2015)Slide46

Gene × SES moderation of genetic varianceSlide47

Scarr-Salapatek (1971)Slide48

World’s literature

(Tucker-

Drob

& Bates, 2015)Slide49

G x SES and Brain Development

Main effect: significant

associations of both gray- and white-matter volumes with parental SES.

G x SES

amplification of children’s

genetic

potential

Tucker-

Drob

& Bates,

2015

Bates

, Lewis, & Weiss,

2013

Predict gene × SES interactions may be present, with increased heritability of brain volumes among higher SES infants.Slide50

Logarithmic link of cortical volume to SES (Noble et al. 2015)Slide51

Results: No support for G x SES

(and reverse/wrong trend)Slide52

Psychometric IQ resultSlide53

Annual Reviews

Why no G x SES?

Effects on a microscopic level?Slide54

The post-synaptic density and IQ

(Hill, … Bates, &

Deary

, 2014)Slide55

Gene interactions later in life?(then why are early years important?Slide56

Forbes magazine

GENESSlide57

SES in parents partly driven by their own genes, which they pass on…

Ritchie,

Plomin

& Bates (2014)Slide58

Summary: No evidence for interaction up to age 3 for gray or white matterSlide59

Infant brain: Complex, Canalized, and Highly Heritable