/
Science highlights from the GCOS Science highlights from the GCOS

Science highlights from the GCOS - PowerPoint Presentation

conchita-marotz
conchita-marotz . @conchita-marotz
Follow
344 views
Uploaded On 2018-11-05

Science highlights from the GCOS - PPT Presentation

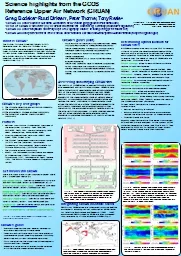
Reference Upper Air Network GRUAN Greg Bodeker 1 Ruud Dirksen 2 Peter Thorne 3 Tony Reale 4 1 GRUAN cochair Bodeker Scientific Alexandra New Zealand gregbodekerscientificcom ID: 716750

sites gruan network climate gruan sites climate network satellite data noaa global temperature trends measurements reference measurement site networks

Share:

Link:

Embed:

Download Presentation from below link

Download Presentation The PPT/PDF document "Science highlights from the GCOS" is the property of its rightful owner. Permission is granted to download and print the materials on this web site for personal, non-commercial use only, and to display it on your personal computer provided you do not modify the materials and that you retain all copyright notices contained in the materials. By downloading content from our website, you accept the terms of this agreement.


Presentation Transcript

Slide1

Science highlights from the GCOS

Reference Upper Air Network (GRUAN) Greg Bodeker1 Ruud Dirksen2, Peter Thorne3, Tony Reale41GRUAN co-chair; Bodeker Scientific, Alexandra, New Zealand (greg@bodekerscientific.com)2Head of GRUAN Lead Centre (LC); Deutscher Wetterdienst, Lindenberg, Germany (ruud.dirksen@dwd.de) 3GRUAN co-chair; Maynooth University Dept. of Geography, Kildare, Ireland (peter@peter-thorne.net)4GRUAN Ancillary Measurement Task Team co-chair; National Oceanic and Atmospheric Administration (tony.reale@noaa.gov)

What is GRUAN?

The Global Climate Observing System (GCOS) Reference Upper Air Network (GRUAN) is an international reference observing network, designed to meet climate requirements and to fill a major void in the current global observing system. GRUAN is envisaged as a global network of 30-40 stations building, where possible, on existing observational networks and capabilities (Fig. 1).

Figure 1:

Current sites in GRUAN

GRUAN’s key user groupsThe climate detection and attribution community.The satellite community.The atmospheric process studies community.The numerical weather prediction (NWP) community.

GRUAN data: ftp://ftp.ncdc.noaa.gov/pub/data/gruanemail: gruan.lc@dwd.de or gruan.chairs@dwd.deWeb page: www.gruan.org

Get involved in GRUANThere are many ways to get involved in GRUAN. There are 5 GRUAN Task Teams viz.:Radiosondes (RAOB): chaired by Masatomo Fujiwara and Rolf Philipona (email fuji@ees.hokudai.ac.jp)GNSS precipitable water vapour: chaired by June Wang and Kalev Rannat (email junhong@ucar.edu)Measurement schedules and associated instrument-type requirements: chaired by Tom Gardiner and David Whiteman (email david.n.whiteman@nasa.gov)Ancillary measurements: chaired by Tony Reale and Thierry Leblanc (email: Tony.Reale@noaa.gov)GRUAN sites: chaired by Belay Demoz and Dale Hurst (email bbdemoz@howard.edu)siteVisit the GRUAN web for more details, publications, etc:

Assessing and certifying GRUAN sitesThe quality of GRUAN sites is assured through a rigorous site assessment and certification process. GRUAN is more than a collection of measurements made at individual sites. Part of the scientific benefit that accrues from GRUAN results from the homogeneity of the reference quality standard of the measurements made at network sites. A shortfall in maintaining that quality standard at one site reduces the users’ confidence in measurements made across the network as a whole. Sites therefore need to be sufficiently consistent and scientifically sound in their operation for the envisioned scientific benefits to accrue. The site certification process, currently underway, assures that all sites operate to the same reference quality standards to guarantee homogeneity of quality across the network (Fig. 2).

Figure

2: The GRUAN site assessment and certification process. While various levels of GRUAN site operation are accommodated, there are also a number of mandatory operating protocols that must be adhered to. Sites are assessed in the context of the added value they bring to the network.

Determining optimal locations for GRUAN sitesA GRUAN workshop was held in June 2012 to develop criteria to guide the development and design of the network with a strong focus on defining the criteria by which potential locations for sites should be evaluated to ensure that the needs of users of GRUAN data are being met. Outcomes were:Global coverage: sites in each of the major climate regions in both hemispheres.Modes of variability: sites to sample the SAM, NAM ENSO etc., permit detection of expansion of the tropics.Environment: forests, deserts, snow and ice, as well as sites on small remote islands and mountain tops.Clear-skies: to minimize uncertainties introduced in radiative transfer modelling.Temporal and spatial co-location: sites located to maximize co-location with satellite overpasses.Historical data: sites with existing long-term homogeneous measurement series are preferable.Existing networks: sites already contributing to existing networks (NDACC, BSRN, SHADOZ) extend the reach of the GRUAN operational philosophy.To best detect temperature trends, sites should be located where:Natural variability is minimal.Auto-correlation is small since auto-correlation reduces the effective number of measurements.Expected trends are large.Monthly mean temperature time series from merged MSU and AMSU were analysed in the context of CCM projected temperature trends (see Figs. 4 and 5). Sites separated by >6000 km in regions of lower time to detect expected trends were then identified.

GRUAN’s goals (cont)Focus efforts on characterizing observational biases, including estimates of measurement uncertainty Ensure measurement traceability through careful metadata observing methods documentation.Ensure long-term stability through instrument change management. Tie measurements to SI units or internationally accepted standards.Ensure that potential gaps in satellite programmes do not invalidate the long-term climate record, thereby leading to improved satellite data products.Further the understanding of climate variability and change.

Figure

4:

Analyses of merged MSU channel 4 and AMSU channel 9 (representative of the lower stratosphere) temperature data – 1978 to 2013. (a) the standard deviation of the monthly means at each location, (b) the first order auto-correlation coefficient, (c) the number of years required to detect a trend of 0.5K/decade, (d) the number of year to detect a chemistry climate model (CCM) projected temperature trend. Site locations show a possible configuration for a global network to detect such trends.

Figure 5:

Same as for Fig. 4 but now using merged MSU channel 2 and AMSU channel 5 (representative of the middle troposphere) temperature data.

PartnersNational contributors (fundamental to success of the enterprise) currently: BoM, CMA, CNR, DOE/ACRF, DWD, FMI, Howard University, JMA, KNMI, MeteoSwiss, NIWA, NOAA, NCARExisting observational networks (NDACC, ARM, GAW, BSRN, GUAN, GSN)The Global Space-based Inter-calibration System (GSICS) and the Sustained, Coordinated Processing of Environmental Satellite Data for Climate Monitoring (SCOPE-CM) InitiativeThe climate science communityWMO; its Commission for Instruments and Methods of Observations (CIMO); Commission on Climatology (CCI); Commission for Basic Systems (CBS); The World Climate Research Programme (WCRP)

Integrating GRUAN in Satellite Cal/Val RAOB from GRUAN sites are integrated in routine satellite atmospheric sounding cal/val conducted at NOAA Center for Satellite Applications and Research (STAR). S-NPP synchronized RAOB funded by NOAA are also processed into reference by LC thus extending GRUAN (Fig 3).

Figure

3: NOAA Products Validation System (NPROVS+) operated at STAR combines GRUAN and NOAA funded dedicated RAOB ( * ) facilitating synergistic analysis and satellite cal/val support.

(https

://www.dwd.de/EN/research/international_programme/gruan/home.html)

GRUAN’s goalsMaintain observations over several decades for accurately estimating climate trends.Constrain and calibrate data from more spatially-comprehensive global observing systems (including satellites and current radiosonde networks).Fully characterize the properties of the atmospheric column and their changes.Measure a large suite of related climate variables with deliberate measurement redundancy.