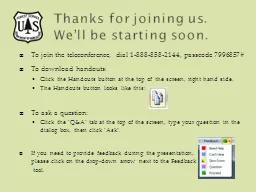
Well be starting soon To join the teleconference dial 18888582144 passcode 7996857 To download handouts Click the Handouts button at the top of the screen right hand side The Handouts button looks like this ID: 399175
Download Presentation The PPT/PDF document "Thanks for joining us." is the property of its rightful owner. Permission is granted to download and print the materials on this web site for personal, non-commercial use only, and to display it on your personal computer provided you do not modify the materials and that you retain all copyright notices contained in the materials. By downloading content from our website, you accept the terms of this agreement.
Slide1
Thanks for joining us. We’ll be starting soon.
To join the teleconference, dial 1-888-858-2144, passcode 7996857#To download handouts:Click the Handouts button at the top of the screen, right hand side.The Handouts button looks like this:To ask a question:Click the ‘Q&A’ tab at the top of the screen, type your question in the dialog box, then click ‘Ask’.If you need to provide feedback during the presentation, please click on the drop-down arrow next to the Feedback tool.Slide2
Updated
process and Public Feedback OpportunitySequoia National Forest Travel Analysis Process, Subpart ASlide3
Travel Analysis Process TeamMaria Ulloa, Forest Program LeadCore Team:Marianne Emmendorfer, team leaderMarcos Rios, Engineering Cherie Klein, Mapping and GIS
Extended Team:Steven Ray, Forest EngineerKaren Miller, Forest Heritage Resource Program ManagerLinn Gassaway, North Zone Archaeologist (Cultural Resources Data Steward)Fletcher Linton, Forest BotanistSlide4
Travel Analysis Process (TAP)The travel analysis process (TAP) is science-based and will inform future travel-management decisions that move administrative units toward the minimum road system (MRS). The TAP considers ecological, social, and economic impacts. The TAP must be documented in a Travel Analysis Report (TAR), which includes:Maps displaying all system roads that shows those
roads which will potentially remain and those that may be removed or changed in the future (under site-specific NEPA). Information about the analysis as it relates to the criteria found in 36 CFR 212.5(b)(1).Slide5
Travel Analysis Process Goal:Management and sustainability of a road system that minimizes adverse environmental impacts by assuring roads are in locations only where they are necessary to meet access needs, and can be maintained within budget constraints.Slide6
Key Factors regarding Travel Analysis Process, Subpart A:In Subpart A, use of motorized trails is only included in the recreation access criteria. Travel Analysis
of motorized trails occurs in Subparts B and C. Subpart A is intended to complement, rather than replace, other planning processes. The Travel Analysis Report does not include a decision under NEPA, instead, it informs future proposed actions regarding the National Forest road system. Slide7
Sequoia Travel Analysis ProcedureImplement the 2005 Travel Management Rule; Use the Region 5 Travel Analysis Process, Subpart A Guidebook (November 2012);Update criteria and analysis from 2003 Sequoia National Forest Road Analysis Process (March 2012); andIdentify opportunities to have a properly sized road system for Sequoia National Forest and Giant Sequoia National Monument. Slide8
Sequoia Road Analysis Process (RAP)Sequoia National Forest personnel conducted a RAP in 2003 in accordance with FSM 7712, which: Evaluated the maintenance level 1 through 5 roads, and considered non-system roads (i.e. county, state and private routes) in the assessment of benefit, risk and opportunities.
Maps and spreadsheets displaying all the system roads and their associated risks and benefits. Information about the analysis as it relates to the criteria found in Forest Service Manual 7700.Slide9
Comparison of Road Analysis and Travel Analysis ProcessesRAP
Process (FS-643, p.16)TAP Process (PSW TAP Guide, p.6)Step 1-Set up the analysis
Step 1-Set up the analysis
Step 2-Describe the situation
Step 3-Identify issues
Step 4-Assess benefits, problems and risks
Step 4-Assess risks, problems and benefits
Step 5-Describe opportunities and set priorities
Step 6-Report
Step 6-ReportSlide10
Sequoia Forest TAP - Aquatic Risk
RAPTAP Guidebook RecommendationsGeologic Hazard
Indicators of Watershed –level Issues: Cumulative effects of roads on aquatic and riparian resources and impact to priority and other high value watersheds
Stream Crossing Density
Riparian Zone – Stream Proximity
Indicators of Degradation of Riparian Areas
: Direct effects on channel and riparian habitat and function and impact to high value resources
Aquatic Risk Factor Composite Rating
Slide11
Terrestrial RiskRAP
TAP Guidebook RecommendationsHeritage Resources
Indicators of Damage to Cultural Resources: Threatened Sites
Road Density Effects to Wildlife Habitat (
roaded
miles per mile squared):
Indicator of Road Density: Disturbance due to road concentration
Indicators of Degradation and Disturbance based on Land Allocation: Roads in PACs
Scenic Resources -the impacts the road segment prism has on scenic integrity.
Indicators for botanical resources:
Indicators for Noxious Weed and Nonnative, Invasive Plants: .
Terrestrial Risk Factor Composite
Rating
Slide12
AccessRAP
TAP Guidebook RecommendationPrivate/Non-recreation Public Access
Public Access (Recreation)
Indicator of Disruption to Quiet Recreation: Proximity to Selected Trails
Indicator of Wilderness Degradation: Road Intrusion in Wilderness
Administrative Site Access.
Vegetation Management
Fire Protection
Roads are a useful tool in protecting areas from fires based on position on slope and continuity of fuelbeds, on whether the road provides access to facilities or private property to be protected, and whether there is a high incidence of ignitions.
Indicator of Human-caused Fire: Proximity to Known Human-caused Fire Origin Points
Access Composite RatingSlide13
SocialRAP
TAP Guidebook RecommendationLifestyle, Attitudes, Beliefs & Values:This factor is based on the extent the road system may affect human lifestyles, attitudes, beliefs, and values. Access to Native American gathering and cultural sites are included here.The PSW Guidance contains Appendix G: Guidance for Communication and Public Engagement.
Economics by Road Maintenance Level
This factor is based on our ability to maintain the existing road system with the current budget.
PSW Guidebook p. 21 states: Appendix C – R5 Economic Analysis Calculator – Annual Road Maintenance was developed to give a broad scale view of the forest’s ability to sustain the unit’s road system at objective maintenance levels with expected levels of funding (FSM 7712.1).
Social Composite RatingSlide14
A Note about Composite RatingsA composite rating of low, moderate and high was assigned to each road based on combining values of the risk or benefit factors. A cumulative score was given from a sum total of all the risk or benefit factors. For example, the TAP aquatic risk composite adds the three factors for a composite range of 3 to 12, which were then added to the composite for terrestrial risks (5-15) for a total risk composite of 8 to 27. This composite was rated: Low=8-13,
Moderate=14-20, or High=21-27Slide15
Composites (continued)Similarly, on the benefits side: Access ratings were summed to give a range of 5-21, and Social ratings were summed to give range of 2-6. The total benefit composite for the TAP is: Low=21-27, Moderate=14-20, or High=7-13NOTE
: The ratings for risk and benefit are flipped numerically and by color. The bottom line for the person who just glances through is: large numbers (red color) are “high risk or low use” and low numbers (green color) are “low risk or high use”.Slide16
Updating the Road SystemThe 2003 RAP considered 1,621 miles of road, and the TAP considers 1,646 miles of road in the Sequoia National Forest designated transportation system. This includes roads designated as “closed”. The additional mileage is due to:Corrections to road mileage from old cartographic features to surveyed data (i.e. GPS) or current imagery,
Adding existing routes to the designated transportation system (i.e. campgrounds around Lake Isabella).Slide17
Corrected Road Route ExamplesSlide18
Analysis Conducted to DateEach road was analyzed using the risk and benefit factors.Criteria where ratings are assigned through GIS analysis were updated in the spreadsheet. Where roads needed a non-GIS update (generally the access criteria) the TAP team reviewed both the map and spreadsheet to determine whether to keep the existing rating, or update it based on the criteria description.When manually updating non-GIS criteria, the team erred on the side of maintaining access.Slide19
Which roads were analyzed?Slide20
Example of Current Mapped Ratings
Current RiskCurrent BenefitCurrent OpportunitiesSlide21
Sequoia TAP Opportunity Categories MatrixRisk Equivalent
Need or Benefit EquivalentLow/Low: Consider for reduced maintenance level, closure, or decommissioning (low priority)
Low/Moderate:
Consider for reduced maintenance level.
Low/High:
Consider for reduced maintenance level.
Moderate/Low: Consider for reduced maintenance level, closure, or decommissioning (medium priority).
Moderate/Moderate:
Consider for road maintenance priority, storm proofing, or reconstruction (medium priority).
Moderate/High: Consider for road maintenance priority, storm proofing, or reconstruction (medium priority).
High/Low: Consider for reduced maintenance level, closure, or decommissioning (high priority).
High/Moderate: Consider for road maintenance priority, storm proofing, reconstruction, or reroute (high priority).
High/High: Consider for road maintenance priority, storm proofing, reconstruction, or reroute (high priority).
Once roads are sorted into these nine rating pair categories, further screening of individual ratings could be done to further refine opportunities and priorities.Slide22
How You can ParticipateThough the TAP core team assigned ratings for the access factors, we need you to review and suggest changes to specific factors: Private and Non-recreation PublicPublic RecreationLifestyles, Attitudes, Beliefs and ValuesWe also need your review for typos or other errors.Slide23
How You can Participate (continued)Go to the website: http://www.fs.usda.gov/goto/sequoia/TAP Review the maps and spreadsheets for those roads you’re interested in; Download the Feedback Form, fill it in, and email it to: comments-pacificsouthwest-sequoia@fs.fed.us
with Subject: Travel Analysis Process; orMail it to the address listed on the form.All Feedback is Due by September 20, 2013Slide24
With your help we can be strategic in how and which roads are maintained into the future.Slide25
For More InformationContact: Marianne Emmendorfer, TAP team leader35860 Kings Canyon RoadDunlap, CA 93621mmemmendorfer@fs.fed.us559-338-2251 extension 313
Website: www.fs.usda.gov/goto/sequoia/TAP