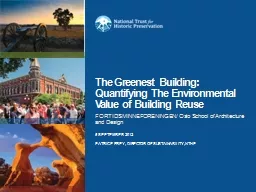
/
The Greenest Building: Quantifying The Environmental Value The Greenest Building: Quantifying The Environmental Value

The Greenest Building: Quantifying The Environmental Value - PowerPoint Presentation

conchita-marotz
conchita-marotz . @conchita-marotz
Follow
418 views
Uploaded On 2016-03-18

The Greenest Building: Quantifying The Environmental Value - PPT Presentation

FORTIDSMINNEFORENINGEN Oslo School of Architecture and Design 5 September 2012 Patrice Frey Director of Sustainability n THP The National Trust for Historic Preservation provides leadership education advocacy and resources to help people save the places that matter to them ID: 260337

energy building climate reuse building energy reuse climate buildings 2012 preservation trust national construction source historic impacts older windows

Share:

Link:

Embed:

Download Presentation from below link

Download Presentation The PPT/PDF document "The Greenest Building: Quantifying The E..." is the property of its rightful owner. Permission is granted to download and print the materials on this web site for personal, non-commercial use only, and to display it on your personal computer provided you do not modify the materials and that you retain all copyright notices contained in the materials. By downloading content from our website, you accept the terms of this agreement.


Presentation Transcript

Slide1

The Greenest Building: Quantifying The Environmental Value of Building Reuse

FORTIDSMINNEFORENINGEN/ Oslo School of Architecture and Design

5 September 2012

Patrice Frey, Director of Sustainability,

n

THPSlide2

The National Trust for Historic Preservation provides leadership, education, advocacy and resources to help people save the places that matter to them.

Nantucket Lightship, Massachusetts

Union Station, Washington DC

© National Trust for Historic Preservation, 2012Slide3

Seattle, Washington

Preservation Green Lab Offices; Seattle, Washington

Objective: Reduce demolitions and improve building performance through research and policy development.Slide4

Presentation Overview

Demolition Tends in the United States

Energy Performance of Older Buildings

Environmental Value of Building Reuse

Reducing Demolitions Slide5

27% Demolished

Source: Brookings Institution

73% Retained

U.S. Demolition Projections

2005−2030Slide6

Chicago Demolitions

Area Demolished 2004-2012:

35 Million Sq Feet /

-- 3.4 Million Sq Meters

Approx 1.8 Sq

Miles

-- 3

Sq

Kilometers

530 Average

City

Blocks

2,353,000 Tons of Debris

Source: Preservation

Green Lab

Chicago, IllinoisSlide7

Architects –prefer blank canvas

Industry/economy aligned behind new constructionEconomics of reuse

Green Builders? Environmentalists?

The Challenges to ReuseSlide8

Source: U.S. Department of Energy, 2003

Older Buildings and Energy

Average annual energy consumption Btu/sq. ft

Commercial Buildings (non malls)

Before 1920

80,127

1920 - 1945

90,234

1946 - 1959

80,198

1960 - 1969

90,976

1970 - 1979

94,968

1980 - 1989

100,077

1990 - 1999

88,834

2000 - 2003

79,703Slide9

Older Buildings and Energy

Median Energy Use Per Sq Ft By Building Type and Age Group

Source; NY University/ City of New York Data 2011-2012

Multi-family Office

Year Built

Source EUI (annual

kbtu

/sq ft)Slide10

Source: U.S. Energy Information Administration,

2005 Residential Energy Consumption Survey

Older Buildings and EnergySlide11

Older Buildings

: Thermal Mass

Monadnock

Building, ChicagoSlide12

Older

Buildings: Glazing/Windows

Source: Monica Arellano-

Ongpin

,

Flickr

Chicago Architecture Today,

FlickrSlide13

Older

Buildings: Passive Ventilation

Source:

Quinn.Anya

,

FlickrSlide14

Challenging Assumptions about Green Building

The greenest buildings are the ones already built.

Building new, more efficient buildings is the only way to address climate change impacts related to the building stock. Slide15

It t

akes

between

35−50 years

for a new, green home to recover the carbon expended during the construction process.

−Empty Homes Agency, UK, 2008

Previous Research: ResidentialSlide16

2006

study compared new construction vs. renovation

Approx

.

38 years

for new, energy efficient building to recover the carbon expended during the construction process

Previous Research:

Institutional

Buchanan Building Complex, University of British Columbia.

Courtesy Martin Nielsen Busby, Perkins & WillSlide17

“The

Greenest

Building”

ReportSlide18

Under what conditions is building reuse environmentally preferable to demolition and new construction? 

Do benefits differ by region and building type?

Are there significant opportunities to reduce

near term

carbon emissions by reusing buildings rather than constructing anew? 

Guiding QuestionsSlide19

Madison Lenox Hotel Demolition, Detroit MI

Embodied energy of existing building viewed as a “sunk cost”

Avoidance of environmental impacts that results from

not

constructing a new building

“Avoided Impacts” ApproachSlide20

Single-family

residential

Multifamily

residential

Urban village

mixed-use

Commercial Office

Elementary

schools

Case Study Buildings

© National Trust for Historic Preservation, 2012.Slide21

Lifecycle Stages

© National Trust for Historic Preservation, 2012.Slide22

Human toxicity

Ionising radiation

Ozone layer depletion

Photochemical oxidation

Respiratory effects

Aquatic ecotoxicity

Land occupation

Terrestrial acidification & nutrification

Terrestrial ecotoxicity

Non-renewable energy

Mineral extraction

IMPACT2002+

Life Cycle Impact AssessmentSlide23

23

Portland

(Mild Climate)

Phoenix

(Hot/Dry Climate)

Chicago

(Cold Climate)

Atlanta

(

Hot/Humid Climate

)

Climate RegionsSlide24

24

Test Conditions

© National Trust for Historic Preservation, 2012.Slide25

Building reuse

almost always yields fewer environmental impacts

than new construction when comparing buildings of similar size and functionality.

Findings: Reuse Matters

© National Trust for Historic Preservation, 2012.Slide26

Findings: Reuse Matters

Commercial Office: Climate Change Impacts

© National Trust for Historic Preservation, 2012.

NC = New Construction

RR = Reuse and Retrofit Slide27

Findings: Reuse Matters

Commercial Office, Portland: Climate Change Impacts

© National Trust for Historic Preservation, 2012.Slide28

It can take between

10 to 80 years

for a new energy efficient building to overcome, through efficient operations, the climate change impacts created by its construction.

© National Trust for Historic Preservation, 2012

Findings: Reuse MattersSlide29

The majority of building types in different climates will take between 20-30 years

to compensate for the initial carbon impacts from construction.

Findings: Reuse Matters

Seattle Washington Mutual Tower Under Construction; Source:

FlickrSlide30

A single

family home

will take between

38-50 years

to

c

ompensate for the initial carbon impacts from construction.

Findings: Reuse Matters

Project7ten - California (pending LEED Platinum); Inhabitat.com Slide31

31

Findings: Reuse Matters

Ecosystem Quality Impacts - Portland

Improving energy efficiency can increase other negative environmental impacts

.Slide32

Findings: Scale Matters

© National Trust for Historic Preservation, 2012.Slide33

Findings: Design Matters

The

quantity and type of materials

used in a building renovation can

reduce, or even negate,

the

environmental benefits

of

reuse when compared to new construction

.

.

© National Trust for Historic Preservation, 2012.Slide34

Warehouse to residential exception

Material inputs resemble new construction

Further research needed on material and energy use of warehouse conversions

Findings:

Design Matters

© National Trust for Historic Preservation, 2012.Slide35

Reducing Demolitions

What are the market and policy barriers to reuse?

How do these vary by city/location?

What incentives are needed to increase reuse? Slide36

Reducing Demolitions

Pioneering new energy code based

on flexibility

and measurement

Exploring incentives for seismic-retrofits

Identifying financing sources for green retrofits

Seattle Space Needle

Source:

FlickrSlide37

Reducing Demolitions – Windows

Source:

Kevitivity

,

FlickrSlide38

Windows Study

D R A F T

Objectives

Characterize performance

of older, leaky, single pane residential

windows

C

ompare

the relative energy savings from window upgrade

measures

Provide recommendations

related to improving window performance across different U.S. climate regions.

 Slide39

39

Portland

(Mild Climate)

Phoenix

(Hot/Dry Climate)

Chicago

(Cold Climate)

Atlanta

(

Hot/Humid Climate

)

Windows Study Climate

Regions

Boston

(Cold Climate)Slide40

Findings

Retrofit Measures Can Achieve Performance Results Comparable to New Replacement Windows.

Almost Every Retrofit Option Offers a Better Return on Investment than Replacement Windows

Green Lab Windows Study Slide41

Green Lab Windows Study

ANNUAL PERCENT ENERGY SAVINGS FOR VARIOUS

WINDOW UPGRADE OPTIONSSlide42

Green Lab Windows Study Slide43

Concluding Thoughts

Energy performance

of

older buildings tends to be very good; “good bones” to work with

Demolition/new construction create significant environmental impacts;

Conclusion: Reuse is a key environmental solutionSlide44

Tusen

takk!

PFrey@savingplaces.org

44Slide45

Older

Buildings: Durability

Source: Scooter,

FlickrSlide46

Older

Buildings: Adaptability

Union Row Apartments, Washington DC