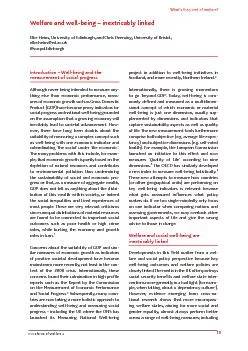
Arie Kapteyn Drawing on joint work with many coauthors including Maria Björnsdotter Dahlin Caroline Tassot Arthur van Soest Jim Smith Gema Zamarro Jinkook Lee Raquel Fonseca ID: 622792
Download Presentation The PPT/PDF document "Well-Being and Comparisons" is the property of its rightful owner. Permission is granted to download and print the materials on this web site for personal, non-commercial use only, and to display it on your personal computer provided you do not modify the materials and that you retain all copyright notices contained in the materials. By downloading content from our website, you accept the terms of this agreement.
Slide1
Well-Being and ComparisonsArie Kapteyn
(Drawing
on joint work with many co-authors, including:
Maria
Björnsdotter
Dahlin
, Caroline Tassot, Arthur van Soest, Jim Smith, Gema Zamarro, Jinkook Lee, Raquel Fonseca,
Hanka
Vonkova
)Slide2
ContentsIncreasing interest in well-beingData sourcesDifferent well-being conceptsHow they hang togetherCan we explain well-being differences?The structure of evaluative well-beingDo we compare to others?Who are these others and what do we know about them?And how do they influence us?
ConclusionsSlide3
Interest in the measurement of Subjective Well-Being has soared over the last decades, not just in AcademiaFrance: Commission on the Measurement of Economic Performance and Social Progress*United Kingdom: Office of National Statistics**United States: Federal Reserve Chairman Ben Bernanke declaring his interest in finding better measurements of Americans’ well-being***Bhutan: Gross National Happiness*****Stiglitz, J. E., Sen, A., & Fitoussi, J. P. (2009). Report by the commission on the measurement of economic performance and social progress.
Paris: Commission on the Measurement of Economic Performance and Social Progress
.
**Dolan
, P., Layard, R., & Metcalfe, R. (2011). Measuring subjective well-being for public policy.
***
Rugaber
, C. S. (2012). Are you happy? Ben Bernanke wants to
know
****http://
en.wikipedia.org/wiki/Gross_national_happiness
Slide4
National Academy of Sciences, USSlide5
International OrganizationsSlide6
Various municipalities now also measure well-beingSlide7
PrecursorsSlide8
Salvador Allende’s ChilePlanned a centrally planned economy with continuous measurement of happiness:“Beer [the designer of the system] built a device that would enable the country’s citizens, from their living rooms, to move a pointer on a voltmeter-like dial that indicated moods ranging from extreme unhappiness to complete bliss.”(Evgeny Morozov: “The Planning Machine”, New Yorker, October 13, 2014)Slide9
Data SourcesThe analyses presented are based on several Internet panels in the Netherlands and in the U.S:CentERpanel in the Netherlands (1996)American Life Panel (ALP) at RAND (2006)Understanding America Study (UAS) at USC (2014)Distinctive features:Recruiting not via InternetProvide Internet access to potential respondents without it
Incidentally: the most complete Internet panel in the world is the LISS panel run by
CentERdata
at Tilburg UniversitySlide10
The American Life Panel as an ExampleSlide11
The RAND American Life Panel
Population
Nationally representative Internet panel, including
vulnerable population sample
5000+ respondents aged 18+, not recruited via internet
Research environment
Timeliness
Access and UsabilitySlide12
The RAND American Life Panel
Population
Nationally representative Internet panel, including
vulnerable population sample
5000+ respondents aged 18+, not recruited via internet
Research environment
Internet mode offers visualization, experiments
etc
Many hours worth of background information (e.g. HRS, cognitive tests)
Timeliness
Access and UsabilitySlide13
The RAND American Life Panel
Population
Nationally representative Internet panel, including
vulnerable population sample
5000+ respondents aged 18+, not recruited via internet
Research environment
Internet mode offers visualization, experiments
etc
Many hours worth of background information (e.g. HRS, cognitive tests)
Timeliness
Approximately two surveys/experiments per month (about 300 since 2006)
Rapid turnaround
Access and UsabilitySlide14
The RAND American Life Panel
Population
Nationally representative Internet panel, including
vulnerable population sample
5000+ respondents aged 18+, not recruited via internet
Research environment
Internet mode offers visualization, experiments
etc
Many hours worth of background information (e.g. HRS, cognitive tests)
Timeliness
Approximately two surveys/experiments per month (about 250 since 2006)
Rapid turnaround
Access and Usability
Data available for download for free
Custom interface allows ability to combine waves, get data in analysis-ready formatSlide15
The panel has been used for continuous Presidential pollingSlide16
Address Based SamplingDraw zip-codes; buy addresses.Advance
notification
letter.
After
1 week, 10 minute mail survey with $5 prepaid
incentive.
$
15 for returning completed survey; survey asks for interest in study participation.
Non-Internet respondents
are offered a tablet and
Internet.
2
weeks after the survey mailing, non-respondents are mailed a reminder
postcard.
2
weeks after the reminder postcard is mailed, a second copy of the survey is mailed to all sample members who have not returned a complete
survey.
3
weeks after the second copy of the survey is mailed, follow-up phone calls, up to 15 attemptsSlide17
How to gauge the quality of probabilitybased Internet panels?Krosnick and co-authors:Various studies over the last decade.Compare telephone, probability based Internet, convenience Internet.
Probability based Internet comes out very
well (in Mean Square Error sense).Slide18
Different Well-Being ConceptsEvaluative Well-Being: Evaluation of life satisfaction/ dissatisfaction Experienced Well-Being: The combination of experienced affect - range of emotions from joy to misery.Positive AffectNegative Affect Eudemonic measures refer to the existence of underlying psychological needs, encompassing various dimensions of wellness, such as autonomy, personal growth, or purpose in
life. Slide19
ExamplesEvaluative (SHARE)How satisfied are you with your life in general? Very satisfied / Somewhat satisfied / Somewhat dissatisfied/ Very dissatisfiedExperienced Questions – Gallup Well-Being IndexDid you experience anger during a lot of the day yesterday? Did you experience
depression
during a lot of the day yesterday
?
Did
you experience
enjoyment
during a lot of the day yesterday?
Did you experience
happiness
during a lot of the day yesterday?
Did you experience
sadness
during a lot of the day yesterday?
Did you experience stress during a lot of the day yesterday?
Did you experience
worry
during a lot of the day yesterday?
Eudemonic
(Office of National Statistics, UK):
Overall, to what extent do you feel that the things you do in your life are
worthwhile
?
(Not at all) 0/1/2/3/4/5/6/7/8/9/10 (Completely)Slide20
By combining experienced well-being with time use, one can paint a picture of well-being during the day and by activityDay Reconstruction Method*:A self-administered time use diary with ratings of positive and negative affect for each period.What do we like most and what do we like least?Most liked: Intimate relations; Socializing; Relaxing;Least liked: Taking care of children; computer/email/internet; housework; working; commuting.*Kahneman, D., Krueger, A. B., Schkade, D. A., Schwarz, N., & Stone, A. A. (2004b). A survey method for characterizing daily life experience: The day reconstruction method.
Science, 306
(5702), 1776-1780.Slide21
Diurnal Patterns (from Kahneman et al. 2004)Slide22
Relation of the Different MeasuresIt appears that evaluative and eudemonic measures are hard to distinguish empirically (they form one factor in factor analysis)Experienced well-being can be decomposed in a positive and a negative factorSo we have three factors in totalKapteyn, A., Lee, J., Tassot, C., Vonkova, H., and Zamarro, G., “Dimensions of Subjective Well-Being”, Social Indicators Research, forthcoming (DOI 10.1007/s11205-014-0753-0; available online at: http://link.springer.com/article/10.1007/s11205-014-0753-0?sa_campaign=email/event/articleAuthor/onlineFirst
). Based on ALP dataSlide23
Example of Experienced Well-Being Scale (Kapteyn, et al. 2014)Slide24
Can we explain well-being differences?Slide25
Life Satisfaction and AgeSlide26
Life Satisfaction and Employment StatusSlide27
Experienced Well-Being and AgeSlide28
Experienced Well-Being and Income (Nothing Significant)Slide29
Experienced Well-Being and Employment StatusSlide30
More on Retirement (SHARE and HRS): CorrelationsSlide31
However, this is not causal*A structural model, using country institutions as instrumental variables shows:Retirement reduces depressionRetirement increases life satisfactionAnd as a bonus:A strong effect of unemployment replacement rates on the life satisfaction of the unemployed.
Fonseca, R., Kapteyn, A., Lee, J., Zamarro, G. (2014), “Does Retirement Make you Happy? A Simultaneous Equations Approach”, Working Paper, CESR, University of Southern California
. Based on SHARE and HRS dataSlide32
The structure of evaluative well-beingWe can explain overall life satisfaction by satisfaction with life domains*. Here are the relative weights:*Kapteyn, A., Smith, J., and Van Soest, A., “Life Satisfaction,” in: Ed Diener, John F. Helliwell, Daniel Kahneman (eds.) International Differences in Well-Being, Oxford University Press, 2010, 70-104. Using CentERpanel
and ALPSlide33
ComparisonsSlide34
To evaluate how we are doing, we need a frame of referenceThat frame can be our own past, or we can compare with others.Who are these others, what do we know about them, and how do they influence us?So we* asked:Who do you compare yourself to (in various life domains)Where do you think you stand?Where do you think others (friends, people in your street, etc.) stand?Next we used that information to explain individual happiness and satisfaction in several domains
Today I am mainly talking about the income domain.
Dahlin
M.B., Kapteyn A., Tassot, C. (2014), “Who are the Joneses?” CESR Working Paper
2014-004; using ALPSlide35
DataAmerican Life Panel (5,475 respondents)Questions aboutHappinessSatisfaction with life domainsComparison groupsComparison intensityZip-code data from American Community Survey (about 3 million households annually)IRS (tax) dataInformation on crime, local and state taxesSlide36
Dependent VariablesHow happy are you? Very HappyHappyNeither happy nor unhappyUnhappyVery unhappy
How
satisfied are you with the total income of your household
?
Very satisfied
Satisfied
Neither satisfied
nor
dissatisfied
Dissatisfied
Very dissatisfied
. Slide37
Subjectively measured own incomeSlide38
Perceived Income of OthersSlide39
Who Matters Most?Slide40
HappinessSlide41
Satisfaction with DomainsSlide42
Who do we compare to?Slide43
FindingsThose who compare most have the highest estimate of other people’s income (and hence they rank their relative position worst)If we consider comparisons with geographic groups (street, postal code, county, etc.) we generally find that higher incomes in these groups raise happiness or the satisfaction with own income. This suggests a public goods interpretation.Own rank raises income satisfaction and happinessComparison with the own age group suggests a strong relative component (if others of my age make more money that reduces my happiness or income satisfaction)Slide44
Conclusions (some more tentative than others)Subjective Well-Being can be succinctly summarized by three dimensions:One evaluative dimensionTwo experienced dimension (one positive, one negative)Determinants of experienced dimensions are less easy to characterize by demographics, policy variables, etc.Evaluative well-being is partly relative (comparisons to others matter), shows stable relations with demographics (e.g. age), and is amenable to policy (e.g. income maintenance policies)Nevertheless, more work needs to be done to gain better understanding who individuals compare themselves with.