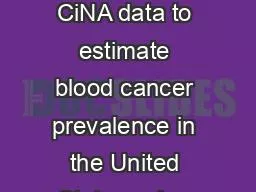
NAACCRiacr 2019 Conference Presented by Vancouver BC Chris Johnson June 13 2019 cjohnsonteamihaorg The Team coauthors Rick Firth IMS Steve Scoppa IMS Andy Lake IMS Recinda Sherman MPH PhD CTR NAACCR ID: 779647
Download The PPT/PDF document "Using NAACCR CiNA data to estimate blood..." is the property of its rightful owner. Permission is granted to download and print the materials on this web site for personal, non-commercial use only, and to display it on your personal computer provided you do not modify the materials and that you retain all copyright notices contained in the materials. By downloading content from our website, you accept the terms of this agreement.
Slide1
Using NAACCR CiNA data to estimate blood cancer prevalence in the United States using more complete geographic coverage and to provide local estimates
NAACCR/iacr 2019 Conference Presented by:
Vancouver, BC Chris Johnson
June 13, 2019
cjohnson@teamiha.org
The Team - coauthors
Rick Firth, IMS
Steve Scoppa, IMS
Andy Lake, IMSRecinda Sherman, MPH, PhD, CTR, NAACCRAngela Mariotto, PhD, NCI
2
Slide3Acknowledgements
This project was supported by the Leukemia & Lymphoma Society (LLS), IMS, and NAACCR.
Participation of Chris Johnson was funded in whole with Federal funds from the National Cancer Institute, National Institutes of Health, Department of Health and Human Services, under Contract No. HHSN261201800006I and the Centers for Disease Control and Prevention, Department of Health and Human Services, under Cooperative Agreement NU58DP006270 to the Cancer Data Registry of Idaho, Idaho Hospital Association.
The findings and conclusions in this presentation are those of the authors and do not necessarily represent the official position of the Centers for Disease Control and Prevention or the National Cancer Institute.
Dataset
: SEER*Stat Database: NAACCR Incidence Data -
CiNA Analytic File, 1995-2015, for Expanded Races, Custom File With County, Johnson - Prevalence WG (which includes data from CDC’s National Program of Cancer Registries (NPCR), CCCR’s Provincial and Territorial Registries, and the NCI’s Surveillance, Epidemiology and End Results (SEER) Registries), certified by the North American Association of Central Cancer Registries (NAACCR) as meeting high-quality incidence data standards for the specified time periods, submitted December 2017.
3
Slide4NAACCR
slide deck
?
a professional organization that develops and promotes uniform data standards for cancer registration
promotes the use of cancer surveillance data and systems for cancer control and epidemiologic research, public health programs, and patient care
“Cancer in North America” (CiNA) is an annual report that provides the most current cancer incidence and mortality statistics for the United States and Canada
Serves as the foundation for:American Cancer Society’s Cancer Facts & FiguresUS Annual Report to the Nation on the Status of Cancer
4
Slide5Wearing my “NA
A
SC
CAR” Hat
5
Homage to first CiNA Survival Volume, which used the theme “I just wanna go fast.”
Slide6Presentation Objectives
Educate participants about the
different types of cancer prevalence statistics
and approaches to estimating them.
Inform participants about use of
NAACCR CiNA data to estimate blood cancer prevalence
in the United States, by state, and for the individual Leukemia & Lymphoma Society (LLS) ChaptersDemonstrate the feasibility of estimating national and local limited-duration prevalence statistics using NAACCR data.6
Slide7Leukemia and Lymphoma Society (LLS) asked NAACCR to estimate prevalence
7
Slide8Prevalence statistics for each state and for LLS Chapters
8
Slide9LLS Chapters
(N = 57)
9
Slide10Background
Cancer prevalence
is the number of persons alive on a certain date who have a history of cancer, so is a function of both incidence and survival.
Information on prevalence can be used for:
health planning
resource allocation
an estimate of cancer survivorship10
Slide11Numbers of cancer survivors
Approximately
38.4%
of men and women will be diagnosed with cancer at some point during their lifetimes (based on 2013–2015 SEER data).
In 2016, there were an estimated
15.5 million cancer survivors
in the United States. The number of cancer survivors is expected to increase to 20.3 million by 2026.11
Source:
https://www.cancer.gov/about-cancer/understanding/statistics
Slide12Background
Complete Prevalence
represents the proportion of people alive on a certain day who previously had a diagnosis of the disease,
regardless of how long ago the diagnosis was
.
Two estimation approaches:
Cross-sectional population-based surveys (self-reporting)But… underreporting and misclassification of diseaseDirect computation (the counting method) Requires registry data that has been collected over a sufficiently long period of time to capture all prevalent cases of the disease.In the US, only Connecticut Tumor Registry
12
Source: https://surveillance.cancer.gov/prevalence/complete.html
Slide13Background
Complete Prevalence
represents the proportion of people alive on a certain day who previously had a diagnosis of the disease, regardless of how long ago the diagnosis was.
Complete prevalence can be estimated from
cross-sectional population-based surveys
(self-reporting)
But… underreporting and misclassification of diseaseDirect computation (the counting method) of complete cancer prevalence requires registry data that has been collected over a sufficiently long period of time to capture all prevalent cases of the disease.In the US, only Connecticut Tumor Registry13
Source: https://surveillance.cancer.gov/prevalence/complete.html
Slide14Counting Method
Requires population-based incidence and follow-up/death ascertainment (fit for use for survival statistics)
Cases still alive on the desired prevalence date are simply counted, while adjustments are made to estimate the proportion of cases lost to follow-up who would have made it to the prevalence date.
The expected number of cases lost to follow-up who make it to the prevalence date is computed using conditional survival curves
14
Source: https://surveillance.cancer.gov/prevalence/approaches.html
Slide15Counting Method Illustration
Mock‐up data are for illustration purposes only. Left side of bars denotes diagnosis date and right side denotes date of death or loss to follow-up*. 5 persons (1, 3, 4, 6, and 7) were known to be alive at the prevalence date. Persons 2 and 5 were deceased prior to the prevalence date. Persons 8 and 9 were lost to follow-up prior to the prevalence date and survival proportions would be applied to estimate their contribution to prevalence.
15
Slide16Background
Limited-Duration Prevalence
represents the proportion of people alive on a certain day who had a diagnosis of the disease within the past
x
years
e.g. x = 5, 10 or 20 yearsRegistries of shorter duration (say, < 40 years) can only estimate limited-duration prevalenceSame two estimation approaches
16
Source:
https://surveillance.cancer.gov/prevalence/limited.html
Slide17An aside… Idaho BRFSS vs. CDRI
CDRI
has collected population-based incidence data since ~1970 (> 45 years for prevalence)
Population Demographics
1.8 million (2018)
12% increase since 2010
For last 2 years, Idaho was fastest-growing stateBehavioral Risk Factor Surveillance System (BRFSS): health-related telephone surveys, partnerships between CDC and states. Idaho included optional module on Cancer Survivorship in 2016Self-reported cancer prevalence estimates, by primary site
17
Slide1818
BRFSS total estimate is much higher than CDRI, and it should be due to non-melanoma skin cancers
It appears that BRFSS respondents may misclassify:
Melanoma and non-melanoma skin cancers
Cervical cancer and cervical intraepithelial neoplasia (CIN) [and maybe ovary]
BRFSS asks about most recent cancer dx, so could be ~20% undercount for some sites (multiple primaries)
For LLS blood cancer types, CDRI estimates are always higher
BRFSS complete prevalence
CDRI 46-yr LD prevalence
Invasive, in situ, benign & borderline brain/CNS
Ages 20+
Slide19Approaches to Estimation Using Cancer Registry Data
Counting Method
Completeness Index - statistical model which estimates complete prevalence from limited-duration prevalence
Back Calculation/Transition Rate Methods – different models use mortality & survival data or incidence & survival data
Cross-Sectional Population-Based Surveys
19
Slide20Where can I find Cancer Prevalence Statistics?
Reports
SEER Cancer Statistics Review
Interactive Tools for Accessing Precalculated Prevalence Statistics
SEER*Explorer
Cancer Query Systems: Cancer Prevalence Database
Cancer Prevalence & Cost of Care Projections websiteComing soon…NAACCR CiNA Prevalence Volume20Source:
https://surveillance.cancer.gov/statistics/types/prevalence.html
Slide21Background
Historically, data from the National Cancer Institute’s
SEER-9
registries have been used to estimate U.S. national complete prevalence.
9.4% population covered, may not be representative
21
SEER-9
Cases diagnosed from 1975 through the current data year
Connecticut
Detroit
Atlanta
San Francisco-Oakland
Hawaii
Iowa
New Mexico
Seattle-Puget Sound
Utah
Slide22Background
Now that NAACCR CiNA
survival statistics
cover almost all registries, we can estimate
prevalence for the U.S.
and also provide local limited duration (LD) prevalence estimates.
22
Slide23Purpose
To describe methods and estimates of 5-year LD cancer prevalence for blood cancers for the U.S., states, and for the individual Leukemia & Lymphoma Society (LLS) Chapters (patient outreach/service delivery areas).
This is the first use of CiNA data to estimate prevalence.
23
Slide24Methods
We estimated
5-year limited-duration prevalence
on Jan 1, 2014 by LLS Chapter and state for:
Hodgkin lymphoma
non-Hodgkin lymphoma
LeukemiaMyelomaall other blood cancers** Myelodysplastic syndrome (ICD-O-3 histology 9989, 9987, 9895, 9986) and Myeloproliferative Disease (9975, 9960, 9961, 9960) both with ICD-O-3 typology C42, C77; Waldenstroms (9761); Polycythemia Vera (9950); Essential thrombocythemia (9962); Myeloid and lymphoid neoplasms with PDGFRA rearrangement (9965/3); Myeloid neoplasms with PDGFRB rearrangement (9966/3 ); Myeloid and lymphoid neoplasms with FGFR1 abnormalities (9967/3)
24
Slide25Methods
CiNA data from November 2017 NAACCR submission
2009-2013 incidence cases and survival
41 states and the Detroit registry
~83% national population coverage
25
Slide26Methods
We used the counting method to estimate prevalence from incidence and follow-up data.
For registries meeting SEER follow-up standards (SEER-18 registries, Montana, and Wyoming), survival estimates were used to adjust for loss to follow-up.
For other registries, it was assumed that all deaths were ascertained through the study cutoff date and remaining persons were presumed to be alive, which may slightly overestimate prevalence.
26
Slide27Methods
For the geographic areas not included in the CiNA Survival Volume, we estimated prevalence using data from
nearest neighbor
Chapters (or states – we did this twice) by:
age (19 age groups: <1, 1-4, 5-9, 10-14… 80-84, 85+)
sex (male, female)
race (white/unknown, black, other)Alabama Chapter (Florida counties), the remainder of Florida (Northern & Central Florida Chapter, Palm Beach Area Chapter, Southern Florida Chapter, Suncoast Chapter), Massachusetts, Michigan (besides counties covered by the Detroit Registry), Kansas, Minnesota, Nevada, North Dakota, South Dakota, part of the National Capital Area Chapter (District of Columbia and Virginia), and the Virginia ChapterDistrict of Columbia, Florida, Kansas, Massachusetts, Michigan, Minnesota, Nevada, North Dakota, South Dakota, and Virginia
27
Slide28Filling in the Gaps
What about geographic areas
not included
in the
CiNA
Survival Volume?
“Borrowed” estimates from nearest neighbors Twice – once for Chapter analysis, once for state analysisStratified by:age (19 age groups: <1, 1-4, 5-9, 10-14… 80-84, 85+)sex (male, female)race (white/unknown, black, other)
28
Slide29Nearest Neighbors
GeoDa
29
Filling in the Gaps
Slide30Example of adjacency results
30
ID of polygon
# adjacent polygons
IDs of adjacent polygons
Slide31Results – Total U.S. including Puerto Rico
Type
5-Year Prevalence on January 1, 2014
Hodgkin Lymphoma
37,464
Non-Hodgkin Lymphoma
232,931Leukemia
141,416
Myeloma
71,211
All other blood cancers
74,151
Total*
552,826
31
*The total is less than the sum of the five blood cancer types because each person is counted only once for each statistic, and some persons have more than one blood cancer.
Slide3232
Total LLS Blood Cancer Prevalence
5-Year LD Prevalence =
552,826
Prevalence Percent = .172%
State Range = .123% - .226%
Darker
red
= higher prevalence percent
Hatching = imputed (adjacency)
Slide3333
Hodgkin Lymphoma Prevalence
5-Year LD Prevalence =
37,464
Prevalence Percent = .012%
State Range = .007% - .016%
Darker
red
= higher prevalence percent
Hatching = imputed (adjacency)
Slide3434
Non-Hodgkin Lymphoma Prevalence
5-Year LD Prevalence =
232,931
Prevalence Percent = .073%
State Range = .052% - .098%
Darker
red
= higher prevalence percent
Hatching = imputed (adjacency)
Slide3535
Leukemia
Prevalence
5-Year LD Prevalence =
141,416
Prevalence Percent = .044%
State Range = .031% - .063%
Darker
red
= higher prevalence percent
Hatching = imputed (adjacency)
Slide3636
Myeloma
Prevalence
5-Year LD Prevalence =
71,211
Prevalence Percent = .022%
State Range = .014% - .030%
Darker
red
= higher prevalence percent
Hatching = imputed (adjacency)
Slide3737
Other Blood Cancers Prevalence
5-Year LD Prevalence =
74,151
Prevalence Percent = .023%
State Range = .011% - .037%
Darker
red
= higher prevalence percent
Hatching = imputed (adjacency)
Slide38Patterns
Maine
,
Massachusetts
*,
New York
, New Hampshire, Wisconsin had the highest prevalence proportionsAlaska, Utah, Puerto Rico, Arizona,
Alabama
had the lowest prevalence proportions
Some variation by type
38
* imputed
Slide39Patterns
Considerable variation in prevalence proportion by state
1.9 to 2.2-fold, by type
3.4-fold for “Other Blood Cancers”
Some variation due to demographics (age, sex, race)
These are
crude prevalence estimates, not age-adjustedBut…
39
Slide40Discussion
For some blood cancers, there are known issues with
reporting delay and potentially missed incidence cases
when the person is diagnosed and treated in a physician’s office, but not seen in a hospital, which may underestimate prevalence.
“Purification through utilization.”
-John Young
40
Slide41“Other blood cancer”
Reporting of chronic myeloproliferative disorders and myelodysplastic syndromes to population-based cancer registries in the United States was initiated in 2001.
Rollinson et al. found substantial differences in incidence rates by state, likely due to underreporting:
“assessment of potential misdiagnosis and underreporting of these malignant conditions is paramount for the elucidation and interpretation of these rates and trends.”
A review of 2011-2015 data (not shown) indicates that inter-state differences remain in ascertaining these cases, with potential incomplete reporting in many states.
41
Rollison DE, Howlader N, Smith MT, Strom SS, Merritt WD, Ries LA, Edwards BK, List AF. Epidemiology of myelodysplastic syndromes and chronic myeloproliferative disorders in the United States, 2001-2004, using data from the NAACCR and SEER programs. Blood. 2008 Jul 1;112(1):45-52. doi: 10.1182/blood-2008-01-134858. Epub 2008 Apr 28.
Slide42Limitations
We are unable to estimate
complete prevalence
using CiNA data.
Net-migration not accounted for
Prevalence statistics calculated using registry data do not include information on persons with a history of blood cancer who move to a new state.
For states with high population growth, the prevalence would be underestimated.
42
Slide43Discussion
The estimates and totals in the reports by state and LLS Chapter differ slightly because the report by LLS Chapter used state/county estimates while the report by state used state estimates, and different base rates were used for projected areas because of the different definitions of nearest neighbors.
43
Slide44Conclusions
This is the first use of CiNA data to estimate prevalence.
83% > 9.4% population coverage
Success. This project demonstrated the feasibility of estimating national and local limited-duration prevalence statistics using NAACCR CiNA data.
44
Slide45Conclusions
This is the first use of CiNA data to estimate prevalence.
83% > 9.4% population coverage
We hope these limited-duration prevalence statistics are useful to states and LLS Chapters for outreach and patient support services.
The success of this project hinged on collaboration between NAACCR, the National Cancer Institute, cancer registries, and Information Management Services, Inc.
This project demonstrated the feasibility of estimating national and local limited-duration prevalence statistics using NAACCR CiNA data. 45
Slide46Next Steps
Extending the methods to other cancer sites
CiNA Prevalence Volume
Coming sometime Fall 2019
46