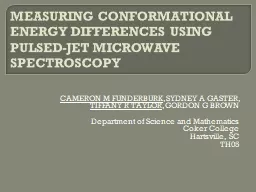
/
MEASURING CONFORMATIONAL ENERGY DIFFERENCES USING PULSED-JET MICROWAVE SPECTROSCOPY MEASURING CONFORMATIONAL ENERGY DIFFERENCES USING PULSED-JET MICROWAVE SPECTROSCOPY

MEASURING CONFORMATIONAL ENERGY DIFFERENCES USING PULSED-JET MICROWAVE SPECTROSCOPY - PowerPoint Presentation

danika-pritchard
danika-pritchard . @danika-pritchard
Follow
369 views
Uploaded On 2018-01-31

MEASURING CONFORMATIONAL ENERGY DIFFERENCES USING PULSED-JET MICROWAVE SPECTROSCOPY - PPT Presentation

CAMERON M FUNDERBURK SYDNEY A GASTER TIFFANY R TAYLOR GORDON G BROWN Department of Science and Mathematics Coker College Hartsville SC TH05 Spectroscopists Microwave Spectroscopists ID: 626813

mhz ratio intensities gauche ratio mhz gauche intensities carrier experiments conformers std 296k relative avg frequency dev predicted pulsed

Share:

Link:

Embed:

Download Presentation from below link

Download Presentation The PPT/PDF document "MEASURING CONFORMATIONAL ENERGY DIFFEREN..." is the property of its rightful owner. Permission is granted to download and print the materials on this web site for personal, non-commercial use only, and to display it on your personal computer provided you do not modify the materials and that you retain all copyright notices contained in the materials. By downloading content from our website, you accept the terms of this agreement.


Presentation Transcript

Slide1

MEASURING CONFORMATIONAL ENERGY DIFFERENCES USING PULSED-JET MICROWAVE SPECTROSCOPY

CAMERON M FUNDERBURK

, SYDNEY A GASTER,

TIFFANY R TAYLOR

, GORDON G

BROWN

Department of Science and Mathematics

Coker College

Hartsville, SC

TH05Slide2

SpectroscopistsSlide3

Microwave Spectroscopists

Frequency

Narrow line-width

Small Error

Intensity

Question: Can we use experimental intensities more effectively?Slide4

Conformational Energy Differences

pre-

Balle

/Flygare

1

pulsed jet cavity

s

tatic cell w/ accurate relative intensitiesexperimental energy differences often reported

1

Balle, T.J.,

Flygare

, W.H.,

Rev. Sci.

Instrum

. 1981,

52

(1), 33–45.Slide5

Conformational Energy Differences

post

Balle

/Flygare

1

pulsed jet (and rise of computing power)

cooling in pulsed jet

use of a cavity – relative intensities not accurateexperimental relative intensities seldom reported

1

Balle, T.J.,

Flygare

, W.H.,

Rev. Sci.

Instrum

. 1981,

52

(1), 33–45.Slide6

Conformational Energy Differences

Chirped-pulse microwave spectroscopy

provides accurate relative intensities

2

do relative intensities agree with energy differences between conformers?

2

Gordon G. Brown, Brian C. Dian, Kevin O. Douglass, Scott M. Geyer, Steven T. Shipman, and Brooks H. Pate,

Rev. Sci.

Instrum

.

79

(2008) 053103.Slide7

Hypothesis:

R

elative

intensities

are

proportional to the conformer populations present before the expansion

occurs (if we use He gas).

We can use relative intensities to measure experimental relative energies between conformers.Slide8

Example: Ethylperoxyl radical

intermediate in ethanol combustion

two conformers,

gauche

and

trans

conformation energies determine

most likely reaction path

reaction kineticsSlide9

Relaxation of conformers in pulsed valves3

3

R.S.

Ruoff

, T.D.

Klots

, T.

Emilsson

, and H.S.

Gutowsky

,

J. Chem. Phys

.

93

, (1990) 3142-3150.Slide10

Relaxation of conformers in pulsed valves3

When helium was used

as the carrier gas all of the conformers showed

little if any

e

vidence of conformer relaxation

That is,

the signal intensities were consistent with the equilibrium ratio

of concentrations (

K

eq

) predicted be the energy difference (

Δ

E) between conformers at T~298K,

K

eq

= f

exp

(-

Δ

E/RT)

1

f = ratio of numbers of equivalent forms (e.g. 2 gauche vs. 1 trans)

3

R.S.

Ruoff

, T.D.

Klots

, T.

Emilsson

, and H.S.

Gutowsky

,

J. Chem. Phys

.

93

, (1990) 3142-3150.Slide11

Relaxation of conformers in pulsed valves3

3

R.S.

Ruoff

, T.D.

Klots

, T.

Emilsson

, and H.S.

Gutowsky

,

J. Chem. Phys

.

93

, (1990) 3142-3150.Slide12

Coker College CP-FTMW Spectrometer4

4

Miranda Smith, Brandon D. Short, April M. Ruthven, K. Michelle Thomas, Michael J. Hang, Gordon G. Brown,  

J. Mol.

Spectr

., 

307

, (2015) 49-53.Slide13

Coker College CP-FTMW SpectrometerSlide14

Target Molecules

propanal

cis

gauche

3

R.S.

Ruoff

, T.D.

Klots

, T.

Emilsson

, and H.S.

Gutowsky

,

J. Chem. Phys

.

93

, (1990) 3142-3150.Slide15

Intensity Ratio Predictions

ethyl

formate

(gauche/trans)

propanal

(gauche/cis)

predicted equilibrium

ratio in valve (T = 296K)

1.63

0.43

predicted

transition

intensities

in jet (1K)

0.86

0.52

Instrument

response

2.0

1.5

overall

predicted intensity ratio

2.8

0.34Slide16

Preliminary experiments:ethyl

formate

trans

10962 MHz

gauche

14059 MHz

ratio (g/t)

1

21.36

3.84

0.18

2

23.26

3.62

0.16

3

28.84

2.41

0.08

4

23.64

3.22

0.14

5

21.48

3.94

0.18

6

21.63

3.77

0.17

7

25.85

4.75

0.18

8

27.13

2.42

0.09

9

25.92

3.57

0.14

10

26.21

3.38

0.13

avg

24.53

3.49

0.15

std

dev

2.62

0.700.04

Experiment 1

:

transition: 2

02

– 1

01

each trial: 100

avgs

Predicted

ratio =

2.8

Expt. 1 ratio =

0.15

set carrier frequency to

ν

– 200 MHz

(10762 MHz and

13859 MHz)Slide17

Preliminary experiments:ethyl

formate

trans

10962 MHz

gauche

14059 MHz

ratio (g/t)

1

8.83

4.42

0.50

2

9.15

4.29

0.47

3

8.84

4.42

0.50

4

8.72

4.44

0.51

5

9.53

4.53

0.48

6

9.18

4.57

0.50

7

9.75

4.73

0.48

8

10.19

4.75

0.47

9

9.36

4.74

0.51

10

10.35

4.99

0.48

avg

9.39

4.59

0.49

std dev

0.57

0.21

0.02Experiment 2:repeat Experiment 1 on different daytransition: 202 – 101 each trial: 100 avgsPredicted ratio = 2.8Expt. 1 ratio = 0.15Expt. 2 ratio = 0.49set carrier frequency to ν – 200 MHz(10762 MHz and 13859 MHz)Slide18

Preliminary experiments:ethyl

formate

trans

10962 MHz

gauche

14059 MHz

ratio (g/t)

1

8.16

6.47

0.79

2

8.04

6.30

0.78

3

7.65

6.76

0.88

4

8.42

6.31

0.75

5

8.20

6.52

0.79

6

7.75

6.29

0.81

7

8.66

6.22

0.72

8

7.94

6.51

0.82

9

8.18

6.50

0.79

10

8.34

6.51

0.78

avg

8.13

6.44

0.79

std dev

0.30

0.16

0.04Experiment 3:repeat Experiment 2 on same day with different carrier frequenciestransition: 202 – 101 each trial: 100 avgsPredicted ratio = 2.8Expt. 1 ratio = 0.15Expt. 2 ratio = 0.49Expt. 3 ratio = 0.79set carrier frequency to ν – 300 MHz(10662 MHz and 13759 MHz)Slide19

Preliminary experiments:ethyl

formate

Further Experiments

:

transition: 2

02

– 1

01

Predicted ratio =

2.8

Experiment

trans

10962 MHz

gauche

14059 MHz

ratio (g/t)

1

24.53

3.49

0.15

2

9.39

4.59

0.49

3

8.13

6.44

0.79

4

7.45

1.12

0.15

5

19.09

3.42

0.18

6

17.89

2.99

0.17

7

17.06

3.13

0.18

8

17.02

2.94

0.17

9

12.65

3.51

0.28

10

12.253.440.281119.472.450.13

12

7.66

5.48

0.71

13

4.20

1.08

0.26

14

11.70

3.08

0.26

15

11.00

3.34

0.30

16

11.42

3.14

0.27

avg

13.18

3.35

0.30

std

dev

5.48

1.34

0.20Slide20

Preliminary experiments:propanal

cis

10493 MHz

gauche

8463 MHz

ratio (g/t)

1

2.51

0.086

0.034

2

2.63

0.084

0.032

3

2.41

0.090

0.037

4

2.432

0.094

0.039

5

2.386

0.096

0.040

6

2.394

0.092

0.039

7

3.981

0.100

0.025

8

3.492

0.100

0.029

9

2.372

0.105

0.044

10

2.59

0.112

0.043

avg

2.720

0.096

0.036

std

dev

0.555

0.009

0.006Experiment 1:transition: 101 – 000 each trial: 500 avgsPredicted ratio = 0.34Expt. 1 ratio = 0.036set carrier frequency to 10000 MHz and8000 MHzRoom Temp (296K)Slide21

Preliminary experiments:propanal

cis

10493 MHz

gauche

8463 MHz

ratio (g/t)

1

2.211

0.1889

0.085

2

2.142

0.1842

0.086

3

2.228

0.1912

0.086

4

2.347

0.1965

0.084

5

2.348

0.1758

0.075

6

2.567

0.1789

0.070

7

2.443

0.1968

0.081

8

2.445

0.1911

0.078

9

2.47

0.1779

0.072

10

2.519

0.1897

0.075

avg

2.372

0.187

0.079

std

dev

0.142

0.008

0.006Experiment 2:transition: 101 – 000 each trial: 500 avgsPredicted ratio = 0.34 (296K)Expt. 1 ratio = 0.036 (296K)Predicted ratio = 0.44 (354K)Expt. 2 ratio = 0.079 (354K)set carrier frequency to 10000 MHz and8000 MHzHeated nozzle (354K)Slide22

Preliminary experiments:propanal

cis

10493 MHz

gauche

8463 MHz

ratio (g/t)

1

1.697

0.1093

0.064

2

1.709

0.1139

0.067

3

1.695

0.1219

0.072

4

1.597

0.1321

0.083

5

1.765

0.1361

0.077

6

1.658

0.1277

0.077

7

1.644

0.1268

0.077

8

1.71

0.1373

0.080

9

1.72

0.1524

0.089

10

1.618

0.1344

0.083

avg

1.681

0.129

0.077

std

dev

0.051

0.012

0.008Experiment 3:transition: 101 – 000 each trial: 500 avgsPredicted ratio = 0.34 (296K)Expt. 1 ratio = 0.036 (296K)Predicted ratio = 0.44 (354K)Expt. 2 ratio = 0.079 (354K)Expt. 3 ratio = 0.077 (296K)set carrier frequency to 10000 MHz and8000 MHzRoom Temp (296K)Slide23

Experimental consistency (?)

all experimental parameters same

valve timing

valve shims

backing pressure

same tank of chemical/He mix

microwave pulse powerSlide24

Conclusion

It is difficult to reproduce signal intensities with a pulsed jet.

We seem to observe conformer relaxation despite using helium as a carrier gas.

Future Work

Compare relative intensities

of conformer spectra, not individual transitions.Slide25

American Chemical Society – Petroleum Research Fund (

56530-UR6)

SCICU Student-Faculty Research Program

Coker College

25

AcknowledgementsSlide26
Slide27

Preliminary experiments:isopropyl alcohol

Experiment date

trans

13254 MHz

gauche

13407 MHz

ratio (g/t)

3/14

0.64

1.30

2.03

3/15

0.43

1.15

2.67

3/15

0.91

1.39

1.53

avg

2.08

std

dev

0.57

Experiment 1

:

transition: 1

01

– 0

00

each experiment:

10 trials of 100

avgs

each

set carrier frequency to

13000 MHz – measured both transitions with same measurements