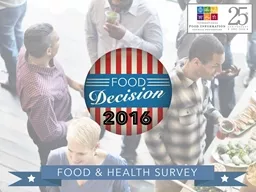
1003 Americans ages 18 to 80 2016 marks the 11 th edition of the Food amp Health Survey allowing for trend analysis for many questions Fielding took place from March 17 to March ID: 775049
Download Presentation The PPT/PDF document " 2 This report presents the results of ..." is the property of its rightful owner. Permission is granted to download and print the materials on this web site for personal, non-commercial use only, and to display it on your personal computer provided you do not modify the materials and that you retain all copyright notices contained in the materials. By downloading content from our website, you accept the terms of this agreement.
Slide1
Slide22
This
report presents the results of an online survey of 1,003 Americans ages 18 to 80.2016 marks the 11th edition of the Food & Health Survey, allowing for trend analysis for many questions. Fielding took place from March 17 to March 24, 2016.The duration of the survey was 29 minutes, on average.The results were weighted to ensure that they are reflective of the American population ages 18 to 80, as seen in the 2015 Current Population Survey. Specifically, they were weighted by age, education, gender, race/ethnicity, and region. Subgroups were reported on for Age, Education, Income, Gender, Those with or without children under 18, BMI and ratings of own health. Additional analysis and subgroups are also included throughout the report.The survey was conducted by Greenwald & Associates, using ResearchNow’s consumer panel.
Background and Methodology
Slide3Table of Contents (Click to jump to each section)
Slides 4
–
17
Slides
69
–
78
Slides
66
–
68
Slides
38
–
65
Slides
18
–
37
Slides
90
– 96
Slides
79
–
89
Slide4foodinsight.org
Slide5Taste continues to have the greatest impact on the decision to buy foods and beverages. Sustainability is up from 2015.
How much of an impact do the following have on your decision to buy foods and beverages?(% Rating 4 to 5 on 5-point scale, from No Impact to A Great Impact)
5
2016 n=1,003Arrows indicate significant (.95 level) differences vs. 2015.
Slide6Expiration date is the most important consideration for seven in ten consumers.
What information do you look at on the food or beverage package when deciding to purchase or eat a food or beverage? (Select all that apply.)
6
2007
(n=1,000)2008 (n=1,000)2009 (n=1,064)2010 (n=1,006)2011 (n=1,000)2012 (n=1,057)2013(n=1,006)2014 (n=1,005)2015 (n=1,007)2016(n=502)Expiration date69%69%67%66%63%76%82%66%51%71%Nutrition Facts panel66%63%69%68%68%66%67%65%49%49%Ingredients list59%51%49%47%49%51%52%52%40%47%Servings size and amount per container50%55%44%36%41%Calorie and other nutrition information48%45%42%29%39%Brand name44%40%50%50%50%46%53%35%27%45%Cooking instructions/preparation time33%45%45%32%25%37%Statements about nutrition benefits44%43%29%29%31%42%43%30%23%26%Country of origin labeling29%26%15%19%Statements about health benefits28%27%20%22%24%30%29%18%15%15%Statement about the absence of certain food ingredients24%23%20%13%17%
Arrows indicate significant (.95 level) differences vs.
2015
Slide7Question format impacts the number of items of packaging information selected by respondents.
7
2016 Sample A n=502; Sample B n=501
This year we asked about the packaging information consumers look at in two ways: 50% of the sample received a version using the “Select all that apply” format (that has been used in all previous years); the other 50% received a version requiring a yes or no answer for each item. When respondents are required to answer, they are much more likely to say they consider information on packaging: on average these consumers select about 3 more items.
What impact does question format have on how consumers respond?
Number of Items Selected
Differences in Items Selected
Slide8Groups more likely to select:College grads,Higher income Have children,Higher income, Age 18-49Age 18-49, College grads, Lower BMILess than a college degree, Lower income
Those willing to pay more for sustainable food are more likely to have read or seen something in the last year that examined the food system and/or commonly held beliefs about diet.
8
Have you done any of the following in the past year?
(Select all that apply.)
2016 n=1,003
Almost four in ten have read or seen something in the last year that examined the food system and/or commonly held beliefs about diet.
Slide9Groups more likely to select: WomenIn better health, Those with kidsAge 18-49,Less than college, Those with kidsThose without children
9
Have you done any of the following as a result of reading that book or article, or watching that movie or documentary? (Select all that apply.)
2016 If read or saw something in the past year n=440
Half have changed their purchasing or engaged friends, family or coworkers as a result of reading or seeing something that examined the food system and/or commonly held beliefs about it.
Those not confident in food supply more likely to change food purchasing after seeing or reading
Slide10Groups morelikely to trust:Age 50-80,WomenAge 50-80, Higher income, Higher BMIMenAge 18-49Age 18-34, Lower incomeAge 18-34
Registered Dietitian/NutritionistYour personal healthcare professionalUS government agenciesHealth-focused Website, such as WebMDA friend or family memberFitness professionalFarmerA food expert on TVHealth, food and nutrition bloggersFood company or manufacturer
Groups more
likely
to trust:Age 50-80Age 18-49Age 18-49Men
Registered Dietitian, Personal healthcare professional and US government agencies are the top three most trusted sources for types of food eaten and food safety.
10
Which one of these sources would you trust the most to provide accurate information about the following issues? (Select up to 3.)
Food safety
Types of food you should be eating
2016 n=1,003
Slide11Even with the addition of new options to choose from, trust for US government agencies has increased since 2015.
11
Which one of these sources would you
trust the most to provide accurate information about the following issues? (Select up to 3.)
2016 n=1,003; 2015 n=1,007
Which one of these sources would you
trust the most to provide accurate information about the following issues? (Select up to 3.)
2015 Food & Health Survey:
57% of consumers trust
a Registered Dietitian/ Nutritionist for both the types of food they should be eating and food safety.
Slide12Nutritionists and Registered Dietitians are by far the most trusted on what foods you should eat and the safety of foods/ingredients, besides a primary physician.
12
Besides your primary physician, which of the following health professionals, if any, would you trust for information on the following issues? (Please select up to 3).
2016 if ranked healthcare professional in top 3 information on food n=671; safety of food n=577
Groups morelikely to trust what foods you should eat:Groups morelikely to trust the safety of the foods and ingredient you eat:WomenAge 50-80, WomenAge 50-80, Higher BMILess than collegeAge 35-80, Those without childrenThose with childrenAge 18-49, Those with childrenLess than collegeMenWomen, Lower BMIWomen, In better healthLower income
Slide13Net: TrustGroups more likely to trust:84%College grads50%Age 18-4971%College grads24%Age 18-6455%49%In better health31%Women26%Age 18-49, In better health, Those with children17% Age 18-49, Those with children13%Age 18-49, Men9%Age 18-64, Men
13
How much do you trust each of the following?
People are more likely to trust the safety of food that is locally produced or from a local restaurant.
2016 n=1,003
Slide1414
Locating the Locavores
Northeasterners are especially likely to favor local restaurants. Also, those who distrust online shopping are also more likely to less favorable views on biotech.
How do Anti-Online Shoppers Feel about “GMOs”?
16%
Are more trusting of locally produced food and local restaurants
Northeasterners are especially more trusting of local restaurants
17%
Do not trust online shopping at all
12%
Trust online shopping a great deal
v
s.
GMO Labeling
Overall GMO Impression
Slide15Liberals and conservatives differ on a number of issues related to food and health.
Trust US government agencies and health, food, for the type of food they should be eating and food safety.
Want more information not currently included on food labels.Have read or seen something in the last year that examined the food system and/or commonly held beliefs about diet.
Liberals are more likely to…
2016 Liberals n=274; Conservatives n=281
Conservatives are less interested in learning about “
mindful eating.”
Done any of the following in the past year that examined the food system and/or commonly held beliefs about diet
15
Slide1616
Sustainability impacts the purchasing decisions of liberals more than it does conservatives. This may be because the two groups see different reasons to care about the issue.
2016 Liberals n=274; Conservatives
n=281*Net of top 3 reasons
Views on Sustainability
Differences in why Sustainability is Important*
Conservatives more likely
Liberals
more likely
Slide17Liberals and Conservatives are divided about what is the most important food safety issue today.
2016 Liberals n=274; Conservatives
n=281*Ranked #1, Most Important
Foodborne illness from bacteria is perceived as the top food safety issue.Conservatives are more likely to say carcinogens are the top safety food issue, where as Liberals are more likely to say it is pesticides. Somewhat liberal are more likely than somewhat conservatives to say food additives are of top concern.
Most important food safety issue*
17
Slide18foodinsight.org
Slide19Who is more likely to report being in better health?College gradsHigher incomeLower BMISpend 15+ minutes eating dinner
Similar to previous years, people typically describe their general health as good to excellent.
19
2016 n=1,003; 2015 n=1,007; 2014 n=1,005
There were no significant (.95 level) differences vs. 2015
How would you describe your own health, in general?
57%
Are In Excellent/Very Good Health
Slide20Although BMI and health status are related, the majority of obese consumers still consider their health to be good or better.
20
2016 n=1,003, 2015 n=1,007; 2014 n=1,005
2015
2014
2016
Obesity Level:
Slide21For one-third of consumers, a healthy food is defined, in part, by what it does not contain.
21
2016 n=1,003Coded for multiple responses
How do you define a healthy food? (Open-ended response)
Does not contain certain components
I define a healthy food as one that doesn't have a large amount of saturated fat, sugars, or artificial ingredients in it.
Male, age 36
A food that is not too heavy in calories, cholesterol or fat, and contains several nutrients needed to maintain optimal health of the
body.
Male, age 20
Good for you
A food that makes my body feel good and does not have any negative impact on my body.
Female, age 19
One that is good for you and has vitamins and minerals our bodies need.
Female, age 67
Contains certain foods/components
High in vitamins and minerals, high in protein, low in sugar and low calorie count while maintaining greater weight so you can stay full longer
.
Male, age 28
A healthy food is one that provides nutritional calories in the form of unsaturated fats, some protein (if applicable), low added sugar and minimal preservatives or chemicals that are not
nutritive. Healthy foods also are nontoxic or minimally toxic.
Female, age 55
Slide22A healthy eating style is most often defined by moderation and including certain “healthy” foods.
22
2016 Sample B n=501Coded for multiple responses
How do you define a healthy eating style? (Open-ended response)
Moderation/serving size and portions
A healthy eating style is eating everything in moderation and appropriately.
Female, age 25
Moderation
and portion control rather than binge eating.
Female, age 26
Includes certain foods I define as healthy
Eating several servings of fruits, vegetables, proteins, fiber and dairy on a daily basis.
Female, age 64
Fruits and vegetables with each meal.
Male, age 59
The right mix of different foods
Balance, half of your plate being fresh fruits and veggies, lean meats, calcium, and an occasional treat.
Female, age 23
A healthy eating style includes a well-balanced diet free of highly processed foods.
Female, age 26
Slide23Groups morelikely to define:College gradsAge 18-49Age 18-49Age 50-80Those without childrenAge 18-34In better healthLess than college,Those without children
When given potential definitions to choose from, half define a healthy eating style as having the right mix of different foods.
23
2016 Sample A n=502
How do you define a healthy eating style
?(Please rank the top 3 attributes that best fit your definition, with 1=Top Choice.)
Slide24The “right mix of different foods” and “eating only foods I define as healthy” are two of the top responses to both the aided and unaided questions on healthy eating style.
24
2016 Aided version n=502; Unaided version n=501
Comparison Between Aided vs. UnaidedHow do you define a healthy eating style?
Aided
(
Top 3 choices)
Unaided
(
Open-end response)
Responses in both aided and unaided versions
The right mix of different foods
51%
21%
Limited or no artificial ingredients or preservatives
41%
2%
Natural foods
37%
3%
Can easily be incorporated into my daily routine
36%
0%
Flexible and easy to maintain over time
26%
<0.5%
Organic foods
25%
2%
Eating only foods I define as healthy
23%
17%
Can include higher calorie treats in moderation
17%
1%
Everything you eat over a long period of time
17%
<0.5%
Non-"GMO" foods
16%
<0.5%
Other responses from the unaided open-end version
Moderation/serving size and portions
26%
Includes certain foods I define as healthy
25%
Limiting certain foods I define as unhealthy
16%
Timing of eating/meals
7%
Avoiding processed food
6%
Cooking food in a certain way
3%
Knowledge about where food came from/what is in it
2%
Other
3%
Slide25“Natural” is most often associated with having no preservatives or additives.
25
2016 n=1,003Coded for multiple responses
What does the term “natural” mean to you (when applied to food)? (Open-ended response)
No preservatives or additives
No preservatives, additives or food coloring. No processed foods.
Female, age 38
Natural nutrients that are ingrained in the food products. That is
,not any artificial chemicals added in the food to enhance shelf life or taste.
Female, age 67
Natural ingredients/straight from nature/whole foods
Taken straight from the source; no chemicals whatsoever have been used on it.
Male, age 20
Not manufactured in a food-plant/factory but instead, grown in nature.
Male, age 48
No artificial ingredients or flavors
It should mean no artificial ingredients, but that is why I read the labels.
Female, age 49
No man-made ingredients.
Female, age 61
Slide26More than a third know at least a fair amount about the MyPlate graphic, although familiarity is down slightly from 2015.
26
2016 n=1,003; 2015 n=1,007Arrows indicate significant (.95 level) differences vs. 2015
How familiar are you, if at all, with the following graphic?
Know Something About Graphic
37%
Know Something About
MyPlate Graphic
Those with children
49%
Those without children33%
Slide27N/A
Net: DoingGroups more likely to be doing:80%Age 35-80, College Grads, Higher income, Women, In better health76%Age 35-80, College Grads, Higher income, Women, In better health 76%Age 35-80, College Grads, Higher income, Women, In better health70%Age 35-80, College Grads, Higher income, Women, In better health65%Age 50-80, Higher income,Women, In better health65%Age 35-80, College Grads, Higher income, Women, In better health, Higher BMI65%Age 35-80, Higher income,Women, In better health62%Age 35-80, College grads,Women, In better health57%Age 50-80, College Grads, Higher income, Women, In better health54%Age 35-80, Women, In better health54%Age 35-80, College Grads, Higher income, Women, In better health, Higher BMI
One-quarter have changed their diet in the past year; most notably making small changes, and eating more fruits and vegetables
.
Over the past year, which of the following, if any, have you made an effort to do?
27
2016 n=1,003; 2015 n=1,007; Arrows indicate significant (.95 level) differences vs. 2015.
Cut back on full fat dairy and replace with a low- or no-fat alternative
Balance calories to manage my weight
Compare sodium in foods like soup, bread, and frozen meals, and choose the foods with lower numbers
Cut back on foods higher in solid fats
Consume smaller portions
Cut back on foods higher in salt
Cut back on foods higher in added sugars
Eat more foods with whole grains
Cut calories by drinking water, low and no calorie beverages
Eat more fruits and vegetables
Made small changes to achieve an overall healthier diet
Slide28Average number of changes made in the past year4.54.64.54.54.94.64.85.22.0
People are most often motivated to change their eating habits to lose weight, protect their long term health, or to feel better and have more energy.
28
Which of the following motivated you to make an effort to change your eating habits? (Select all that apply.)
2016 if made any changes in the previous year n=536
Slide29Almost six in ten are trying to lose weight with a third trying to lose ten pounds or more.
29
Which of the following best describes what you are currently doing
regarding your weight?
2016 n=1,003, 2015 n=1,007; 2014 n=1,005; 2013 n=1,006Arrows indicate significant (.95 level) differences vs. 2015.
23% are trying to lose up to ten pounds.34% are trying to lose ten or more pounds.
Slide30Net: LikelyGroups more likely to select:78%Age 50-80, College grads, Higher income, Women, In better health72%College grads, Higher income, Women, In better health71%Age 35-80, College grads, Higher income, Women, Higher BMI70%Age 35-80, College grads, Higher income, Women65%Age 50-80, Women, Higher BMI64%Age 35-80, Women, Higher BMI63%Age 35-80, Higher income, Women, Those with children, Higher BMI61%Age 35-80, College grads, Women, In better health61%Women, Those with children
Being more active during the day and increased exercise are the most likely methods of weight management.
30
How likely do you think you would be to use or continue using each of the following methods of weight management in the next year?
2016 n=1,003;
There were no significant (.95 level) differences vs. 2015
Slide31Who is more likely to use nutrition information?
Age 18-49College gradsHigher incomeHigher BMIIn better health
When eating out at restaurants, half of consumers use the nutritional information on menus.
31
How, if at all, have you used nutrition information (like calorie counts, etc.) when eating out at restaurants?
2016 n=1,003; 2015 n=1,007; There were no significant (.95 level) differences vs. 2015
52%
Use Nutrition Info
Those willing to pay more for sustainable food are more likely to use nutritional information when eating out at restaurants.
Slide32Net: Always/sometimesGroups more likely to say:80%Age 50-80, Women, Those without children70%Age 35-80, College grads, Higher income, Women64%Higher income, Women, Those with children, Higher BMI, Those who spend less than 15 minutes eating60%Higher income, Women, Higher BMI46%Age 50-80, Higher income, Men, In better health
Four out of five will stop eating when they’ve had enough but not too much.
32
How often do you do the following?
2016 n=1,003
Slide332015 Food & Health Survey:
A third of Americans spend less than 15 minutes eating dinner on an average weekday.
33
On an average weekday, how
much time do you personally spend eating dinner?
2016 n=1,003; 2015 n=1,007
33%
Less Than 15 Minutes
How much time do you personally spend cooking or
preparing
dinner on the average weekday?
More likely to spend less than 15 minutes:
Less than collegeMenIn poorer health
Slide34Three out of five have not heard of “mindful eating.”
34
Which of the following best describes your familiarity and interest in the practice of “mindful eating”? (sometimes referred to as “intuitive eating”)
2016 n=1,003
53%
Want to learn more
Heard it and want to learn more
Age 18-49
College gradsWomenLower BMI
Have not heard
and
want to learn more
Higher BMI
Slide35Top 2 examples to learn more about topics like “mindful eating”?WebMD, GoogleGoogle, WebMDNutritionist, DietitianVarious blogs(e.g. Health.com, Fitness.com)Doctor, Nutritionist
Those interested in learning more about “mindful eating” are more likely to learn more at a health website.
Where would you be most likely to go if you wanted to learn more about topics like “mindful eating”?
(Please select just your top answer.)
35
2016 if interested in learning more about “mindful eating” n=555
Those with a higher income are more likely to learn from a health website.
Those without children are more likely to learn from an online news source.
Those in better health are more likely to learn from a personal healthcare professional
.
Slide36Those that have heard of “mindful eating” most often define it as noticing when they are hungry or full and eating slowly.
Which of the following are included in your definition of “mindful eating”? (Select all that apply.)
36
2016 if has heard of “mindful eating” n=362
Groups more likely to select:
Women
Women
Women
College
grads, Higher income, Women
Men
Men
Less than college,
Men
Slide37Three in ten think all sources of calories are equally likely to cause weight gain; however, one in four believe sugar is more likely to cause weight gain.
What source of calories are the most likely to cause weight gain?
37
Protein
Fats
Carbohydrates
Sugars
All
sources same
Not sure
2016 n=1,003There were no significant (.95 level) differences vs. 2015
What source of calories are the most likely to cause weight gain?
Slide38foodinsight.org
Slide39More Americans are trying to consume several nutrients and components, with protein and fiber topping the
list.
39
Protein
FiberWhole grainsVitaminsPotassiumNatural flavorsOmega-3 fatsProbioticsNatural colorsOmega-6 fatsFortified foodsEnriched refined grainsSoyPrebioticsCaffeineLow-calorie sweeteners in generalSteviaMono- and poly-unsaturated fatsFats/oilsFlavonoidsGluten
To what extent do you try to consume or avoid the following?
% Try to limit or avoid
% Try to consume
2016 n=1,003; Arrows indicate significant (.95 level) differences vs. 2015.
NEW
NEW
NEW
NEW
NEW
NEW
Slide4040
Packaged
foods
Sodium/saltMonk fruitSugars in generalSaturated fatsSucraloseAspartameSucroseAcesulfame potassiumFructoseArtificial flavorsPreservativesArtificial colorsHigh fructose corn syrupGMOsMSGAdded sugars
Consumers are also trying to limit or avoid more components in 2016, such as added sugars, high fructose corn syrup, and preservatives.
To what extent do you try to consume or avoid the following?
% Try to limit or avoid
2016 n=1,003; Arrows indicate significant (.95 level) differences vs. 2015.
NEW
NEW
NEW
NEW
% Try to consume
Slide41Higher income, Women
Those with childrenAge 50-80, Higher income,Women, In better healthAge 50-80, College grads, Higher income,Women, In better healthWomenMenWomenWomenAge 35-80*Lower incomeAge 65-80, College grads, Higher income,Women, Those without childrenMen, In better healthCollege grads, WomenWomenIn better healthWomenCollege gradsLower incomeWomenWomenCollege grads, WomenCollege grads, Higher income, In better healthThose without childrenWomenAge 18-34WomenWomen
Protein
FiberWhole grainsVitaminsPotassiumNatural flavorsOmega-3 fatsProbioticsNatural colorsOmega-6 fatsFortified foodsEnriched refined grainsSoyPrebioticsCaffeineLow-calorie sweeteners in generalSteviaMono- and poly-unsaturated fatsFats/oilsFlavonoidsGluten
% Try to limit or avoid
Subgroups more likely to take action on components
41
To what extent do you try to consume or avoid the following?
NEW
NEW
NEW
NEW
NEW
% Try to consume
*Age 65-80 is even more likely to select than Age 35-64.
NEW
Slide42College grads, WomenAge 18-34Age 50-80Age 35-80, College grads,Higher income, WomenLess than college, In better healthCollege grads, Higher income,Women, In better healthCollege grads, Higher incomeCollege grads, Higher incomeHigher BMIAge 35-80, College grads,Higher income, Higher BMIIn better healthCollege gradsCollege grads, Higher income, Higher BMICollege grads, WomenIn better healthWomenLess than collegeCollege grads, WomenLess than collegeCollege grads, Higher income, WomenCollege grads, WomenAge 35-80, College grads, WomenAge 18-34, Less than collegeCollege grads, Higher income,Women, In better health
42
Packaged
foods
Sodium/saltMonk fruitSugars in generalSaturated fatsSucraloseAspartameSucroseAcesulfame potassiumFructoseArtificial flavorsPreservativesArtificial colorsHigh fructose corn syrupGMOsMSGAdded sugars
Subgroups more likely to take action on components
To what extent do you try to consume or avoid the following?
NEW
NEW
NEW
NEW
% Try to limit or avoid
% Try to consume
Slide43Family and friends are influential in changing opinion on grains and proteins. Consumers are influenced about fats by a variety of sources.
Thinking about the past year, how has your opinion changed, if at all, about the healthfulness of…
2016 n=1,003
*Not including “Other”
Opinion Change: Grains, Proteins, and Fats
43
Top 2 factors influencing opinion change*
More healthful
Less healthful
Friend/Family (22%)
2 sources tied for 2
nd
(13%)
Friend/Family (17%)
Media headline or article (14%)
Friend/Family (16%)
Media headline or article (14%)
Friend/Family (15%)
Reading a scientific study (12%)
Reading a scientific study (20%)
Friend/Family (15%)
Friend/Family (16%)
3 sources tied for 2
nd
(11%)
Friend/Family (17%)
Media headline or article (17%)
Friend/Family (12%)
2 sources tied for 2
nd
(10%)
Registered Dietitian
(22%)
Reading a scientific study (15%)
Media headline or article (18%)
Reading a scientific study (15%)
Friend/Family (19%)
Registered Dietitian
(14%)
Office visit w/
healthcare prof. (16%)
Reading a scientific study (15%)
Slide44Half have not changed their opinion in the last 12 months about the healthfulness of enriched refined grains.
2016 n=1,003; More healthful n=99; Less healthful n=188
Thinking about the past year, how has your opinion changed, if at all, about the healthfulness of enriched refined grains?
If opinion changed
Opinion Change: Enriched Refined Grains
Has this change in opinion altered your consumption?
What one source has altered your opinion the most?
44
Slide45One in five people have an improved opinion on the healthfulness of whole grains. Seven in
ten with this improved opinion are consuming more.
2016 n=1,003; More healthful n=213; Less healthful n=81
If
opinion changed
Thinking about the past year, how has your opinion changed, if at all, about the healthfulness of whole grains?
Opinion Change: Whole Grains
Has this change in opinion altered your consumption?
What one source has altered your opinion the most?
45
16%
Slide46Almost three in five opinions have not changed in the last year about the healthfulness of animal protein.
2016 n=1,003; More healthful n=127; Less healthful n=149
Thinking about the past year, how has your opinion changed, if at all, about the healthfulness of animal protein (ex: meat, fish, or dairy)?
If opinion changed
Opinion Change: Animal Protein
Has this change in opinion altered your consumption?
What one source has altered your opinion the most?
46
Slide47One in five people have an improved opinion on the healthfulness of plant protein and many are trying to consume more.
2016 n=1,003; More healthful n=222; Less healthful n=78
If
opinion changed
Thinking about the past year, how has your opinion changed, if at all, about the healthfulness of protein from plant sources (ex: soy, nuts, or beans)?
Opinion Change: Protein from Plant Sources
Has this change in opinion altered your consumption?
What one source has altered your opinion the most?
47
Slide48A quarter now believe saturated fat is less healthful. Half have not changed their opinion.
2016 n=1,003; More healthful n=45; Less healthful n=272
If
opinion changed
Thinking about the past year, how has your opinion changed, if at all, about the healthfulness of saturated fat?
Opinion Change: Saturated Fat
Has this change in opinion altered your consumption?
What one source has altered your opinion the most?
48
Slide49Half have not had their opinion change in the last 12 months about mono- and poly- unsaturated fats, but one in five believe them to be less healthful than they used to.
2016 n=1,003; More healthful n=63; Less healthful n=190
If
opinion changed
Thinking about the past year, how has your opinion changed, if at all, about the healthfulness of mono- and poly- unsaturated fat?
Opinion Change: Mono- and Poly- unsaturated Fat
Has this change in opinion altered your consumption?
What one source has altered your opinion the most?
49
Slide5050
Poultry
Eggs
Beans, nuts, and seedsFishMilk and dairyBeefPorkSoyOther
Poultry and eggs are the proteins most often consumed; whereas beef is the protein most often limited or avoided.
Which type of protein are you trying to consume or avoid? (Please select all that apply.)
% Try to avoid
% Try to consume
2016 if trying to consume or avoid protein n=695
Slide51Groups more likely to select:College grads, Lower BMI, In better healthLower incomeLower incomeAge 18-34, Spend less than 30 minutes eatingAge 18-49, College grads
Four in ten do not consume more protein because they believe they already get enough protein in their diet.
51
Which of the following are reasons why you do not consume more protein than you do now?
2016 Sample A n=335; Arrows
indicate significant (.95 level) differences vs. 2015.
Slide52Groups more likely to select:Higher BMIAge 65-80, Higher income, In better health
For a third of consumers, a lack of awareness of which foods contain healthy unsaturated fats is a barrier to consumption.
52
Which of the following are reasons why you do not consume more healthy unsaturated fats like Omega-3 fatty acids than you do now?
2016 Sample B n=333.
Slide53Groups more likely to select:Age 65-80, Those without children, Lower BMILower BMILess than college
A third of consumers feel that they already get enough whole grains in their diet.
53
Which of the following are reasons why you do not consume more grains than you do now?
2016 Sample C n=335.
Slide5454
Many nutrients in food are associated with health benefits. Which health benefits are you most interested in getting from foods? (Please select up to 3.)
2016 n=1,003.
Almost half are most interested in weight loss benefits associated with nutrients in food.
Groups more likely to select:
Those with children, Higher
BMI
Age 50-80, Men
Age 50-80, Higher income, Those without children, In better health
Age 35-
80, Women
Age 50-80,
Women, Those without children
Age 18-34, Men
Women, Higher BMI
Lower BMI
Age 18-49,
Less than college, Lower income, Spend more than 30 minutes eating
Slide55Groups more likely to see as healthful:Age 50-80, Higher income, WomenAge 65-80, College grads, Higher income, Lower BMI, In better healthCollege grads, Higher income, Women, Lower BMI, In better healthAge 35-80, WomenAge 18-49, College gradsAge 35-80, College grads, Women Those without childrenCollege grads, Higher income, Women, Age 50-80, Those without childrenLower BMI
55
How
would you rate the healthfulness of each of the following?
2016 n=1,003
Four out of five rate Vitamin C as healthy, while only 1 in 4 rate Ascorbic Acid as
healthy.
Slide56A third of
Americans
view added sugars and low calorie sweeteners as less healthful than they used to, mainly due to media headlines and articles.
Thinking about the past year, how has your opinion changed, if at all, about the healthfulness of…
2016 n=1,003*Not including “Other”
Opinion Change: Natural Sugars, Added Sugars, and Low Calorie Sweeteners
56
Top 3 factors influencing opinion change*
More healthful
Less healthful
Media headline or article (19%)
Friend/Family (18%)
Friend/Family (12%)
Media headline or article (12%)
Friend/Family (28%)
Reading a scientific study (19%)
Media headline or article (17%)
Reading a scientific study (15%)
Registered Dietitian
(23%)
Media headline or article (15%)
Media headline or article (23%)
Reading a scientific study (15%)
Slide57Nearly one in five people
have changed their opinion on “natural” sugars, and now view them as more healthful.
Thinking about the past year, how has your opinion changed, if at all, about the healthfulness of “
natural” sugars (ex: from fruit or honey)?
If opinion changed
Has this change in opinion altered your consumption?
What one source has altered your opinion the most?
2016 n=1,003; More healthful n=178; Less healthful n=114
Opinion Change: Natural Sugars
57
Slide58Has this change in opinion altered your consumption?
One-third believe “added” sugars are less healthful than they used to be. Of those that believe it is less healthful, eight in ten are consuming less.
2016 n=1,003; More healthful n=40; Less healthful n=368
If
opinion changed
Thinking about the past year, how has your opinion changed, if at all, about the healthfulness of “added” sugars (ex: table sugar or high fructose corn syrup)?
Opinion Change: Added Sugars
What one source has altered your opinion the most?
58
Slide59Nearly one-half have not changed their opinion on the healthfulness of low-calorie sweeteners, while one-third believe them to be less healthful than they used to.
2016 n=1,003; More healthful n=47; Less healthful n=331
Thinking about the past year, how has your opinion changed, if at all, about the healthfulness of low calorie sweeteners (ex: Sucralose, Aspartame)?
If opinion changed
Has this change in opinion altered your consumption?
Opinion Change: Low Calorie Sweeteners
What one source has altered your opinion the most?
59
Slide60Groups more likely to select:Age 65-80MenLower income, Higher BMIAge 18-34, Higher income, Women, Lower BMI
Almost half consume foods and/or beverages with low-calorie sweeteners to help reduce the number of calories they consume.
60
Earlier you indicated that you may consume foods and/or beverages containing low-calorie sweeteners at least sometimes. What are your reasons for doing so? (Select all that apply.)
2016 if consumes low-calorie sweeteners n=106; Arrows indicate significant (.95 level) differences vs. 2015.
Slide61Groups more likely to select:College grads, Higher incomeAge 50-80, Higher incomeCollege grads, Higher incomeHigher incomeLess than college, Lower income
Opinions on low-calorie sweeteners are split. One in five don’t agree with any statement and one in three do not know enough about low-calories sweeteners.
61
Which of the following statements, if any, do you agree with regarding low-calorie sweeteners? (Select all that apply.)
2016 Sample A n=501; Arrows indicate significant (.95 level) differences vs. 2015.
Slide62Groups more likely to select “True”:Age 65-80, College grads, WomenAge 50-80, College grads, Higher income, Women, Those who spend more than 30 minutes eatingHigher income, Higher BMI
Two-thirds believe that moderate amounts of sugars can be part of an overall healthful diet.
62
As far as you know, which of the following statements, if any, are true?
2016 n=502; 2015 n=1,007: Arrows indicate
significant (.95 level) differences vs. 2015
Moderate amounts of sugars can be part of an overall healthful dietSugars that are naturally found in foods and beverages are more healthful than other sugarsPeople with diabetes can include some foods and beverages with sugar as part of their total dietIt is not necessary to completely eliminate sugars from your diet in order to lose weight
Slide63Groups more likely to select:Women, In better healthIn better healthAge 50-80, Those without childrenHigher BMIAge 50-80, Men, Those without children, Higher BMIHigher BMI, In worse healthAge 65-80, MenLess than college, Lower income, In better health
Seven in ten drink water instead of caloric beverages as a way to reduce their consumption of sugars.
63
What actions are you taking to achieve reduction in your consumption of sugars? (Select all that apply.)
2016 if avoids or limits sugars in general, added sugars, HFCs, or low-calorie sweeteners n=753
Slide64Groups more likely to select:Age 65-80Age18-64, Spend less than 15 eating dinnerIn better health
One-third avoid or limit packaged foods because they contain artificial ingredients or preservatives, or have extra sugar, fat and salt.
64
Which of the following do you consider the top reason why you avoid or limit packaged foods?
2016 Avoids or limits packaged foods n=376
Slide65Groups more likely to select:Age 65-80, In better health
One in three consume packaged foods because they are convenient.
65
Which of the following do you consider the top reason why you consume packaged foods?
2016 Tries to consume packaged foods n=34
Slide66foodinsight.org
Slide67One third of Americans don’t know the amount of caffeine that is in the foods and beverages they consume.
67
Please indicate how much you agree or disagree with the following statement
:I know the amount of caffeine that is in the foods and beverages I consume.
2016 Of those who consume caffeine n=939; 2015 n=913; Arrows indicate significant (.95 level) differences vs. 2015
69%
Know Amount of Caffeine Consumed
Who is more likely to know amount of caffeine consumer?
Higher incomeIn better health
Slide68Almost half are unsure if caffeine that is naturally occurring has the same effect as caffeine that is added to foods and beverages.
68
Please indicate whether the following statement is true or false: Caffeine that is naturally occurring in foods and beverages has the same effect as caffeine that is added to foods and beverages.
2016
n=1,003; There were no significant (.95 level) differences vs. 2015
Who is more likely to
believe?
Men
Slide69foodinsight.org
Slide70Two-thirds are confident in the safety of the U.S. food supply.
70
2016 n=1,003; Arrows indicate significant (.95 level) differences vs. 2015.
Overall, how confident are you in the safety of the U.S. food supply?
66%
Are confident in the safety of the food supply
Who is more likely to be confident in the safety of the U.S. food supply?
Age 35-80
Higher incomeMenIn better health
Those confident in the safety of the U.S. food supply are more likely to:
Trust the safety of food produced in their region
and
from outside the U.S.
Trust the safety of a local
and
national chain restaurant
Slide7171
In your opinion, what is the most important food safety issue today? (Please rank from 1 to 3, with 1=Most Important.)
2016 n=1,003; if respondent chose food additives, chemicals in food, or carcinogens or cancer-causing chemicals in food as food safety issue n=386
Foodborne illness from bacteria, chemicals in food and pesticides are the most important food safety issues today.
Have
you changed your eating habits because of something you’ve heard or read about food additives and ingredients, chemicals in food, or carcinogens in food?
Slide72Groups more likely to select:College grads, Those with childrenWomenLower BMIThose without children, In better healthHigher incomeLower BMI
72
Where do you go for information
about food additives and ingredients/chemicals in food/carcinogens in food? (Please select all that apply.)
2016 if respondent chose food additives, chemicals in food, or carcinogens or cancer-causing chemicals in food as food safety issue n=386
The top source of information about food additives, chemicals or carcinogens in food is health websites,
followed by news channels and government agencies
.
Slide73At least two in five are more likely to be influenced by the benefits of rice, seafood, and red meat over the potential risks. However, the opposite is true for preservatives: almost half are more likely to be influenced by their potential health risks.
73
When shopping, which of the following is more likely to influence what you purchase...
2016 n=1,003
The health benefits of rice foods, like brown rice or rice cereal
The potential risk that rice foods have low levels of naturally occurring arsenic
Not likely to consider either option
The health benefits of protein and healthy fats in seafood, like canned tuna
The potential of mercury contamination in seafood
Not likely to consider either option
The benefit of longer shelf life that preservatives provide
The potential health risks posed by preservatives in food
Not likely to consider either option
The health benefits of red meat
The potential that red meat may be linked to cancer
Not likely to consider either option
Slide74Almost all have heard of Salmonella as a problem in food but consumers are split about whether food with Salmonella bacteria on it can be made safe.
74
If
yes
Have you ever heard of Salmonella as a problem in food?
2016 n=1,003; If heard of Salmonella=914; Arrows indicate significant (.95 level) differences vs. 2014.
To the best of your knowledge, which of the following would make something safe to eat if it had
Salmonella bacteria on it? (Select all that apply.)
Slide75Net: LikelyGroups more likely to be concerned84%Age 50-80, Women74%Age 50-80, Women, Those without children, In worse health71%Age 50-80, Women, Those without kids63%Age 50-80, Less than college, Women, Those without kids55%Age 50-80, Less than college, Women, Those without children
More than seven in ten consider raw chicken, raw eggs and raw pork likely to have Salmonella germs.
How likely is it that the following foods have Salmonella germs that can make you sick?
75
2016 n=1,003; Arrows
indicate significant (.95 level) differences vs. 2015.
Slide7676
2016 n=1,003; 2015 n=1,007Arrows indicate significant (.95 level) differences vs. 2015.
Which of the following actions do you perform regularly when cooking, preparing, and consuming food products? (Select all that apply.)
Four in five wash their hands with soap and water regularly when cooking, preparing, and consuming food products.
Note about the trend difference in “cook to required temperature”:
In 2015, consumers were asked directly if they owned a thermometer. In addition, they were given a definition of a food thermometer: “By food thermometer, we mean a thermometer that is used to check the internal temperature or doneness of meat, poultry, or other dishes. Do not include candy thermometers or thermometers used to check the temperature of oil when frying.”Likely because of this information, we see a difference in consumers reporting to cook to a required temperature.
Slide77Groups more likely to select Yes:Age 18-64*College grads, WomenCollege gradsCollege grads, Those with children
77
Which of the following, if any, would encourage you to use a
food thermometer more often than you do?(% Yes)
Not currently using a food thermometer: 2016 n=697; 2015 n=389; There were no significant (.95 level) differences vs. 2015.*Age 18-34 is even more likely to select than Age 50-64.
Half would be encouraged to use a food thermometer more often if they were given a free thermometer.
Slide78Seven in ten has heard of E. coli 0157 as a problem in food, and almost half think food with this bacteria cannot be made safe to eat.
78
If
yes
Have you ever heard of E. coli 0157 as a problem in food?
2016 n=1,003, If heard of E. coli 0157 n=704.
To the best of your knowledge, which of the following would make something safe to eat if it had
E. coli 0157
bacteria on it?
(Select all that apply.)
Slide79foodinsight.org
Slide80Almost six in ten try to reduce food waste by taking leftovers home from restaurants.
Which of the following do you actively try to do to reduce the amount of food you waste/throw-away?
(Select all that apply.)
80
2016 n=501
Groups more likely to select:
Age 65-80, College grads, Higher income
Age 50-80, Higher income
In better health
Age 50-80, Higher income, Women
Age 50-80, Those without children
College
grads
Women
College grads, In better health
Those
without children
Age 65-80, In better health
Age 18-34, Those without children
Slide81The top contributors to food waste are forgetting about perishables and purchasing too much fresh food.
What
contributes the most to the amount of food waste you produce? (Please select just your top answer.)
81
2016 n=502*Age 65-80 is even more likely to select than Age 35-64.
Groups more likely to select:
College grads
Those without children
Age 18-34, Those who eat
in less than 30 minutes
Those who eat
in less than 30 minutes
Age 18-34
Higher BMI
Those without children, Lower BMI, In better health
Those without children
Age 35-80*, Lower income
Slide82Two-thirds think it is very important to ensure all people have access to healthy food.
82
Knowing that the global population will rise from 7 billion to 9.5 billion by the year 2050, how important do you think it is to ensure all people have access to healthy food?
2016 n=1,003
85%
Think it is important
Who is more likely to see it as important
?
Age 50-80
College grads
Higher income
Women
Slide83Seven in ten see modern agricultural practices as having at least a small role in ensuring that all people have access to healthy food.
83
Do you see a role for modern agricultural practices (precision farming, biotechnology, etc.) in ensuring that all people have access to healthy food?
2016 if believes important to ensure all have access to healthy food n=861
70%
See a role
Who is more likely to see
a role?
College grads
Higher income
Men
Slide84Seven in ten think it is important that the food products are produced in a sustainable way.
84
How important is it to you that the food products you purchase or consume are produced in a sustainable way?
2016 n=1,003
73%
Think it is important
Who is more likely to see it as important?
Age 50-80
College grads
Women
In better health
Slide85Four in ten find conserving the natural habitat and reducing the amount of pesticides used to produce food to be important ways to produce sustainable food.
85
What 3 aspects of producing food in a sustainable way are most important to you?
(Net of top 3 choices picked)
2016 If believes important that food products are produced sustainably n=751
Groups more likely to select:
Women, Lower BMIAge 35-80, WomenHigher BMIAge 50-80, Higher incomeAge 65-80College grads
Groups more likely to select:
Age 18-34, Higher income, Men
Age 18-49
Those with children,
Lower BMI
Age 18-49, Lower income
Slide86People are split on whether they would pay more for food and beverage products that are produced sustainably.
86
Are you willing to pay more for food and beverage products that are produced sustainably?
2016 n=1,003
Who is more likely
to pay?
College grads
Higher income
Lower BMI
In better health
Slide87Groups more likely to select:College grads, Higher income, MenCollege grads, MenMenCollege grads, Men, Those without childrenCollege grads, MenAge 35-80, WomenLess than college, Lower income, Women
A third need more information to make an informed decision of the role of biotechnology.
87
As you may know, some food products and medicines are being developed with the help of scientific techniques. One such technique is genetic engineering, which is used to produce crops and food products known as GMOs”.Do you think there is a role for biotechnology (“GMOs”) in...?(Select all that apply.)
2016 n=1,003
Slide88Net AgreeGroups more likely to agree:56%Age 50-8053%Age 50-8051%Age 50-80, Those without children47%Age 50-8037%Less than college
Half agree that modern agriculture produces nutritious foods, safe foods, and high-quality foods.
In general, to
what extent do you agree or disagree with the following statements about the use of modern tools, equipment, and technologies in agriculture? Modern agriculture...
88
2016 n=1,003
Slide89Groups more
likely to select:
College grads, WomenCollege gradsCollege grads, WomenAge 50-80, WomenAge 50-80, Women, Those without childrenWomen, Lower BMIHigher income, Lower BMILess than college, Men
Groups more likely to select:Lower income, In better healthCollege grads, Higher income,Women, In better health College grads, Women,In better healthWomenWomenCollege grads, In better healthLess than college,In worse health
Consumers are less impacted by labeling in restaurants than they are at the grocery store.
89
Which of the following, if any, do you do on a regular basis? (Select all that apply.)
Eat at restaurants because they advertised their foods and beverages as...
Buy foods and beverages because they are advertised on the label as...
2016 Sample A n=502; Sample B n=501; There were no significant (.95 level) differences vs. 2015.
NaturalNo added hormones or steroidsLocally-sourcedOrganicRaised without antibioticsPesticide-freeNon-“GMO”Sustainably sourcedNone of the above
NEW
NEW
Slide90foodinsight.org
Slide91A quarter support the FDA policy requiring special labeling for foods produced with biotechnology as it stands. Four in ten would like to see expanded labeling.
91
The U.S. Food and Drug Administration (FDA) requires special labeling for foods produced with biotechnology (“GMO”) only when the food produced by biotechnology is substantially different (for example, if the food has a different nutritional content). Would you say that you support or oppose this FDA policy?
2016 n=1,003
23%
Support this policy as it stands
Who is more likely to
support the policy as it stands?
Age 18-34
Men
Slide92One in six wish to see more information on labels. Of those, GMO labeling is one of their top concerns.
92
If
yes
Can you think of any information that is not currently listed on food labels that you would like to see on food labels?
2016 n=1,003; If would like to see more information on food labels n=168
What information not currently included on food labels would you like to see on the labels? (Open-ended response)
Slide93There is a diversity of opinions about the use of biotechnology to produce food products.
93
What is your overall impression of using biotechnology (“GMO”) to produce food products? Would you say you are...?
2016 n=1,003
22%
Have a favorable impression
Who is more likely to
have a favorable impression?
College grads
Higher income
Men
Slide94Three-quarters believe farmers and veterinarians should be allowed to treat animals with antibiotics if they become sick.
94
If a food-producing animal gets sick, should farmers and veterinarians be allowed to treat the animal with antibiotics?
2016 n=1,003
74%
Believe in treating the animal
Who is more likely to
believe in treating the animal?
College grads
Higher income
Slide95Purchasing animal productsAge 50-80In better health
Three in five would be more confident that veterinarians and farms are using antibiotics responsibly if the FDA requires veterinary oversight for all uses of antibiotics.
95
2016 Sample A n=501
The US Food and Drug Administration will soon prohibit growth-promotion uses of antibiotics and only allow antibiotics to be used in food producing animals to fight illness. How would this impact your level of confidence that veterinarians and farmers are using antibiotics responsibly?How would this change impact your level of confidence in purchasing meat, poultry, egg, and milk products? Would you be...?
More likely to be confident
Antibiotics used responsibly
Age 50-80
In better health
Slide96Purchasing animal productsAge 65-80Higher income
Three in five would be more confident that veterinarians and farms are using antibiotics responsibly if the FDA requires veterinary oversight for all uses of antibiotics.
96
2016 Sample B n=502
The US Food and Drug Administration will soon require veterinary oversight for all uses of antibiotics in food-producing animals. Once the rule is implemented, supervision from a veterinarian will be required to administer antibiotics to food-producing animals. How would this change impact your level of confidence that antibiotics are being used responsibly by veterinarians and farmers? Would you be...?How would this change impact your level of confidence in purchasing meat, poultry, egg, and milk products? Would you be...?
More likely to be confident
Antibiotics used responsibly
Age 65-80
College
grads
Higher income
Slide97Respondent Profile
97
Age(n=1,003 )Gender(n= 1,003)18 to 34 years old 31%Male 49%35 to 49 years old 26Female 5150 to 64 years old 2665 to 80 years old 17Age of Children in HouseholdEducation0 to 2 years old 4%Less than high school 3%3 to 6 years old 5Graduated high school 407 to 12 years old 11Some college (no degree) 2213 to 17 years old 10Associates degree, technical or vocational school 718 or older 37Bachelor’s degree 18There are no children under 18 in my household 44Graduate/Professional work or degree 10Prefer not to say 1Race/EthnicityMarital StatusWhite (Non-Hispanic) 69%Married 49%Hispanic/Latino/Spanish descent 16Single 29Black or African American 12Divorced 12Asian or Pacific Islander 6Living with partner 6American Indian or Alaskan Native 2Widowed 3Native Hawaiian 1Other <0.5Other 1Prefer not to say <0.5
Slide98Respondent Profile
98
Pregnant within past 12 months
(n=284)
Medical Conditions
(n=1,003)
Yes
6%
High blood pressure
25%
No
94
High cholesterol
20
Region
(n=1,003)
Stress/anxiety/depression
12
Northeast
18%
Diabetes
9
Midwest
21
Overweight/obesity
6
South
37
Heart disease
2
West
23
Cancer
2
Household Income
ADHD
2
Less than $35,000
19%
Osteoporosis
2
$35,000 to less than $50,000
19
Stroke
1
$50,000 to less than $75,000
17
Alzheimer’s or related forms of dementias
<0.5
$75,000 to less than $100,000
15
None of the above
55
$100,000 to less than $150,000
11
BMI score
$150,000 and above
5
Normal or low
35%
Don’t know
1
Overweight
30
Prefer not to answer
11
Obese
30
No answer
5
Slide99Respondent Profile
99
Political Leaning
(n=1,003)
Political Party
(n=1,003)
Very Liberal
9%
Democrat
36%
Somewhat Liberal
17
Independent
28
Moderate
32
Republican
25
Somewhat Conservative
18
Not sure
11
Very Conservative
11
Not sure
13