PDF-ISSN CEP Discussion Paper No March Does Working from Home Work Evidence from
Author : debby-jeon | Published Date : 2014-09-23
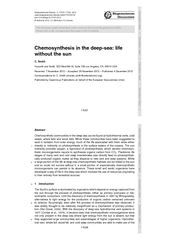
Call center employees who volunteered to WFH were randomly assigned to work from home or in th e office for 9 months Home working led to a 13 performance increase
Presentation Embed Code
Download Presentation
Download Presentation The PPT/PDF document "ISSN CEP Discussion Paper No March D..." is the property of its rightful owner. Permission is granted to download and print the materials on this website for personal, non-commercial use only, and to display it on your personal computer provided you do not modify the materials and that you retain all copyright notices contained in the materials. By downloading content from our website, you accept the terms of this agreement.
ISSN CEP Discussion Paper No March Does Working from Home Work Evidence from: Transcript
Download Rules Of Document
"ISSN CEP Discussion Paper No March Does Working from Home Work Evidence from"The content belongs to its owner. You may download and print it for personal use, without modification, and keep all copyright notices. By downloading, you agree to these terms.
Related Documents