/
Lecture  White and red noise Christopher S Lecture  White and red noise Christopher S

Lecture White and red noise Christopher S - PDF document

debby-jeon
debby-jeon . @debby-jeon
Follow
582 views
Uploaded On 2014-12-28

Lecture White and red noise Christopher S - PPT Presentation

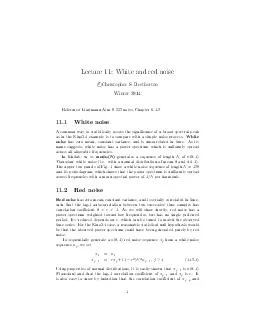
Bretherton Winter 2014 Reference Hartmann Atm S 552 notes Chapter 612 111 White noise A common way to statistically assess the signi64257cance of a broad spec tral peak as in the Nino34 example is to compare with a simple noise process White noise h ID: 30463

Bretherton Winter 2014 Reference

Share:

Link:

Embed:

Download Presentation from below link

Download Pdf The PPT/PDF document "Lecture White and red noise Christopher..." is the property of its rightful owner. Permission is granted to download and print the materials on this web site for personal, non-commercial use only, and to display it on your personal computer provided you do not modify the materials and that you retain all copyright notices contained in the materials. By downloading content from our website, you accept the terms of this agreement.


Presentation Transcript

Lecture11:Whiteandrednoisec\rChristopherS.BrethertonWinter2014Reference:HartmannAtmS552notes,Chapter6.1-2.11.1WhitenoiseAcommonwaytostatisticallyassessthesigni canceofabroadspectralpeakasintheNino3.4exampleistocomparewithasimplenoiseprocess.Whitenoisehaszeromean,constantvariance,andisuncorrelatedintime.Asitsnamesuggests,whitenoisehasapowerspectrumwhichisuniformlyspreadacrossallallowablefrequencies.InMatlab,w=randn(N)generatesasequenceoflengthNofn(01)`Gaussian'whitenoise(i.e.withanormaldistributionofmean0andstd1).TheuppertwopanelsofFig.1showawhitenoisesequenceoflengthN=128anditsperiodogram,whichshowsthatthepowerspectrumisuniformlyspreadacrossfrequencieswithameanspectralpowerof1=Nperharmonic.11.2RednoiseRednoisehaszeromean,constantvariance,andisseriallycorrelatedintime,suchthatthelag-1autocorrelationbetweentwosuccessivetimesampleshascorrelationcoecient0r1.Aswewillshowshortly,rednoisehasapowerspectrumweightedtowardlowfrequencies,buthasnosinglepreferredperiod.Its`redness'dependsonr,whichcanbetunedtomatchtheobservedtimeseries.FortheNino3.4case,areasonablestatisticalnullhypothesiswouldbethattheobservedpowerspectrumcouldhavebeengeneratedpurelybyrednoise.Tosequentiallygeneratean(01)rednoisesequencexjfromawhitenoisesequencewj,wesetx1=w1xj+1=rxj+(1r2)12wj+1;j1(11.2.1)Usingpropertiesofnormaldistributions,itiseasilyshownthatxj+1isn(01)(Gaussian)andthatthelag-1correlationcoecientofxj+1andxjisr.Itisalsoeasytoshowbyinductionthatthecorrelationcoecientofxj+pand1 Amath482/582Lecture11Bretherton-Winter20142 0 50 100 -3 -2 -1 0 1 2 3 jwjWhite noise 0 50 100 -3 -2 -1 0 1 2 3 jxjRed noise (r = 0.85) -50 0 50 0 0.01 0.02 0.03 0.04 0.05 MSpectral power -50 0 50 0 0.05 0.1 0.15 0.2 MSpectral power Figure1:Whiteandrednoisetimeseries(left)andtheirperiodograms(right)xjforp�1isrp=exp(plogr)=exp(Rpt),whereR=logr=tisthedecorrelationrate.Theautocovariancesequenceofrednoisethusdecaysexponentiallywithlag.Thelagatwhichtheautocorrelationdropsto1=eis=R1Thefunctionrednoise.m(classwebpage)implementsthisalgorithm,ItwasusedwiththewhitenoisesequenceontheupperleftofFig.1andr=085togeneratetherednoisetimeseriesonthelowerleft.Theperiodogramofthissequence,showninthelowerright,nowhasapredominanceofspectralpowerinlowharmonicsM11.3TheoreticalpowerspectrumofrednoiseThetruepowerspectrumofn(01)rednoiseismosteasilydeducedastheDFTofitsautocovariancesequence.Ratherthangrindingthroughdiscretesums,itismorehelpfultointerprettheDFTasaRiemannsumthatapproximatesthecontinuousintegralforthecomplexFouriercoecientsofthecontinuous Amath482/582Lecture11Bretherton-Winter20143functiona(t)=eRjtj;L-periodicallyextendedfort�L=2):Sm=N1DFT(a)cMMa(t)]]=L1ZL=2L=2eRjtji!MtdtSofar,theapproximationisgoodifRt1and!1Mt1,sothata(t)exp(i!mt)iswellresolvedbythegridofspacingt.IfinadditionRL=21,theintegrandbecomesverysmallfort�L=2.Then,withnegligi-bleerrorwecanextendtherangeofintegrationtoin nity:SmL1Z11eRjtji!Mtdt=L1Z01et[Ri!M]dt+Z10et[R+i!M]=L11 Ri!M+1 R+i!M=L12R R2+!2M=! R R2+!2M(!=2 L)(11.3.1)Thepowerspectrumofrednoisehasamaximumvalueforlowfrequencies!MR,anddecreasesathighfrequencies-a'red'spectrum,asclaimed.Ifwesumthepowerspectrumacrosstheharmonics,andthinkofitasaRiemannsumapproximationtoacontinuousintegralNXm=1SmN=21XM=N=2! R R2+!2M1 Z(N=21)!N!=2d!R R2+!21 Z11d!R R2+!2=1 tan1(!=R) 11=1ConsistentwithParseval'stheorem,wehavededucedthatthepowerspectrumsumsto1,thevariancethatweconstructedourrednoisetohave.Inthisderiva-tion,extendingthelimitsoftheintegraltoin nityisagoodapproximationifN!=2R.SinceN!=2=N=L==t,thisisequivalenttoRt1,whichwastheassumptionwemadeinderivingthediscreterednoisespectrum(thattherednoiseiswellresolved). Amath482/582Lecture11Bretherton-Winter2014411.4FittingrednoisetodataOnecommonwayof ttingtheautocorrelationsequenceisarednoise t,asanexponentiallydecreasingfunctionoflag.This tisshowninplotaschaindash,usingane-foldingtimeof=61months.Roughlyspeaking,measurementsclosertogetherthanwillbesigni cantlycorrelatedandthosefurtherapartwillbeonlyweaklycorrelated.Thiscanbecastintermsofae ectivelag-1autocorrelationr=exp(t=)(=0.85inourcase).Becausetheactualautocorrelationisnotexactlyanexponentiallydecreasingfunctionoflag,risnotexactlythesameasthetruelag-1autocorrelationof0.9.Scriptnino2addsared-noise ttotheSSTApowerspectrumbasedon=61monthsandscaledtomatchtheobservedvarianceofSSTA.Therearefourharmonicsinthe0.2-0.4yr1rangethatclearlystandabovetherednoisespectrum.Totesthowlikelythisistobeachanceoccurrence,wenowlookforalessnoisywaytoestimatethepowerspectrum.