PPT-Length of Expansion in Years
Author : debby-jeon | Published Date : 2017-07-30
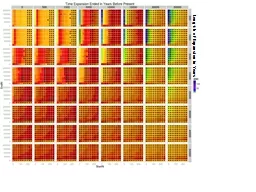
Supplementary Figure 1 Fit between model and observed data E1b1a The color of each of the smallest rectangular units indicates the value of AND measuring
Presentation Embed Code
Download Presentation
Download Presentation The PPT/PDF document "Length of Expansion in Years" is the property of its rightful owner. Permission is granted to download and print the materials on this website for personal, non-commercial use only, and to display it on your personal computer provided you do not modify the materials and that you retain all copyright notices contained in the materials. By downloading content from our website, you accept the terms of this agreement.
Length of Expansion in Years: Transcript
Download Rules Of Document
"Length of Expansion in Years"The content belongs to its owner. You may download and print it for personal use, without modification, and keep all copyright notices. By downloading, you agree to these terms.
Related Documents