/
x0000x0000JP Morgan Center for Commodities at the University o x0000x0000JP Morgan Center for Commodities at the University o

x0000x0000JP Morgan Center for Commodities at the University o - PDF document

deborah
deborah . @deborah
Follow
342 views
Uploaded On 2022-09-21

x0000x0000JP Morgan Center for Commodities at the University o - PPT Presentation

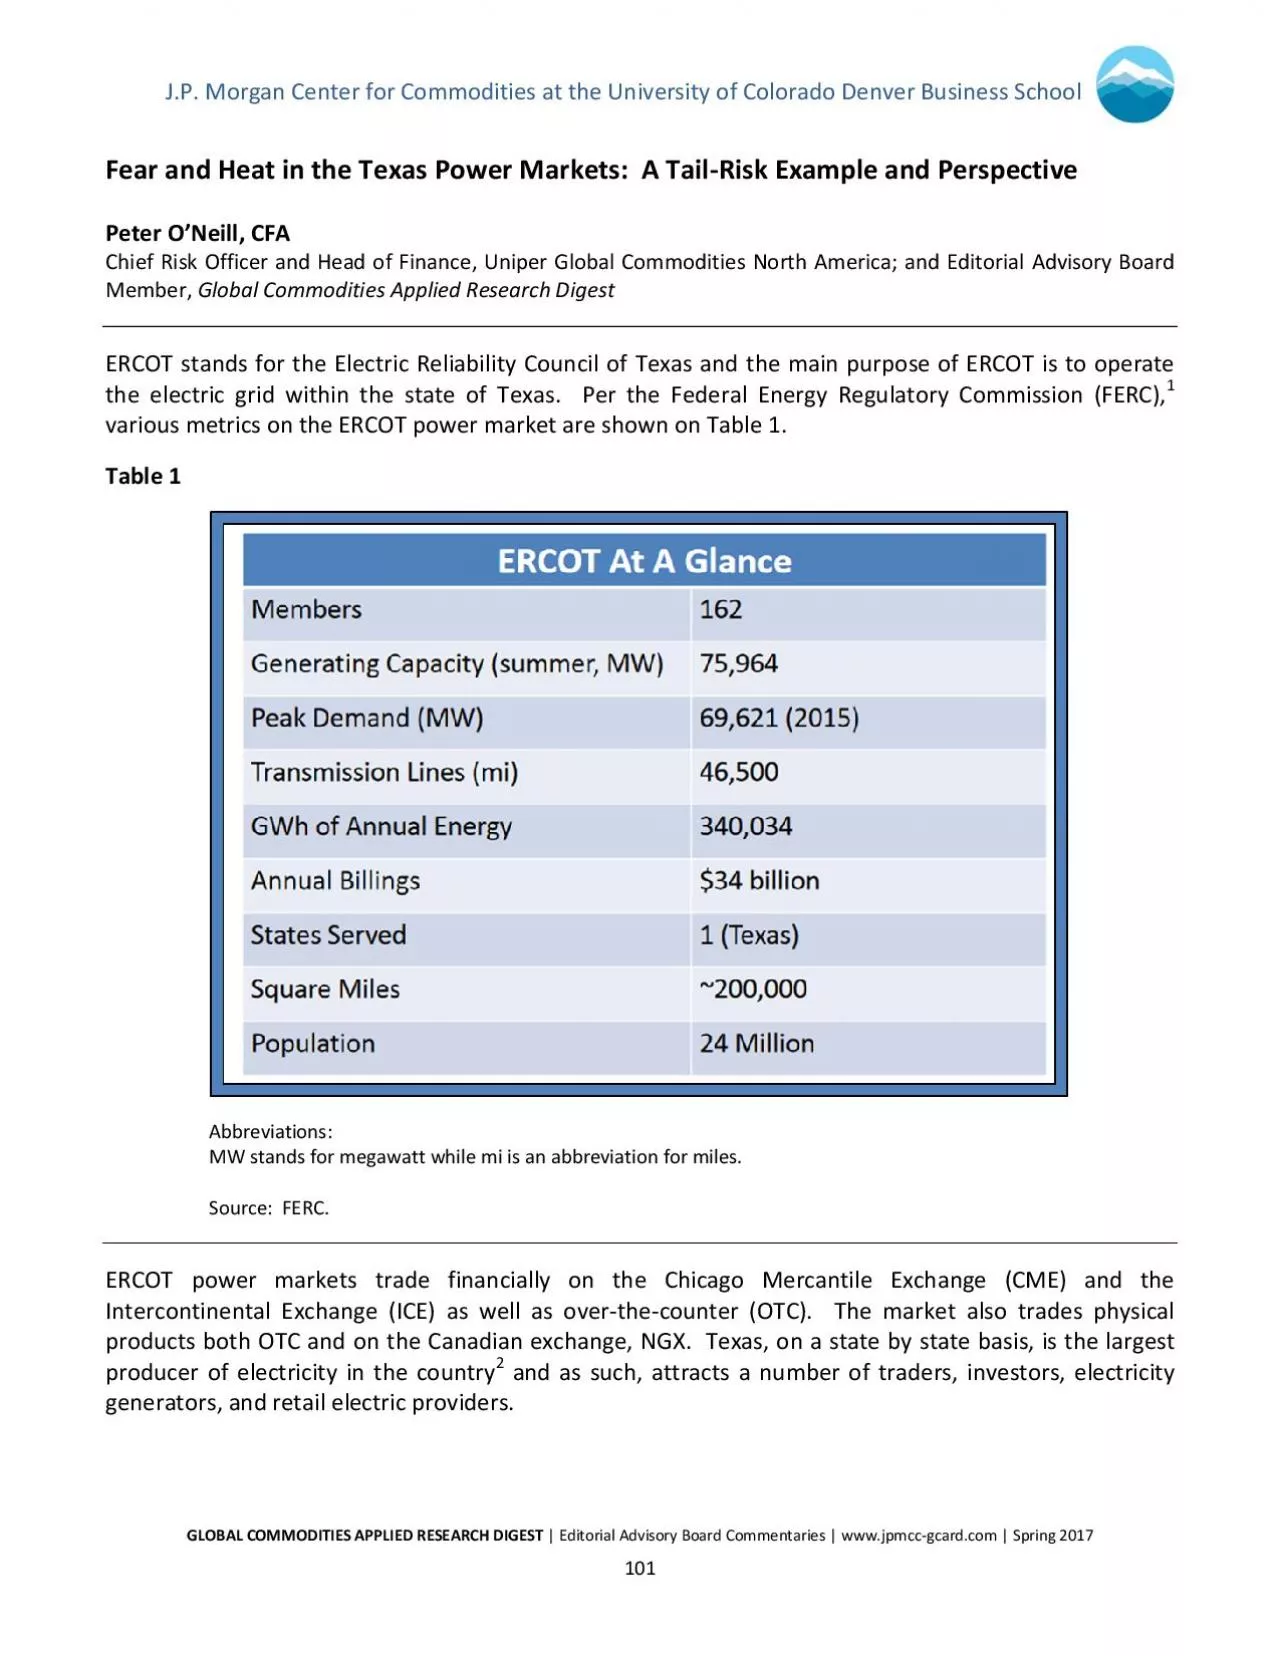
GLOBAL COMMODITIES APPLIED RESEARCH DIGEST Fear and Heat in the Texas Power Markets A Tail ERCOT stands for the Electric Reliability Council of Texas and the main purpose of ERCOT is to operate E ID: 954664

power market risk price market power price risk ercot prices x0000 texas peak short markets www commodities elec global

Share:

Link:

Embed:

Download Presentation from below link

Download Pdf The PPT/PDF document "x0000x0000JP Morgan Center for Commoditi..." is the property of its rightful owner. Permission is granted to download and print the materials on this web site for personal, non-commercial use only, and to display it on your personal computer provided you do not modify the materials and that you retain all copyright notices contained in the materials. By downloading content from our website, you accept the terms of this agreement.


Presentation Transcript

��J.P. Morgan Center for Commodities at the University of Colorado Denver Business School GLOBAL COMMODITIES APPLIED RESEARCH DIGEST| Fear and Heat in the Texas Power Markets: A Tail ERCOT stands for the Electric Reliability Council of Texas and the main purpose of ERCOT is to operate ERCOT �� Fear and Heat in the Texas Power Markets: A TailRisk Example and Perspective GLOBAL COMMODITIES APPLIED RESEARCH DIGEST| Editorial Advisory Board Commentaries| www.jpmccgcard.| Spring 2017 One of the main differences between ERCOT and other power markets in the U.S.is the lack of a capacity market. In brief, capacity markets are a type of forward market power plants receive compensation for the ability to provide power at a future date. In regions where capacity markets exist, capacity commitments are a tool that allows the grid operator to ensure that reliability exists on the grid and to better plan for future years. Capacity markets provide signals for when longerterm investments in generation are required. Generators also of course receive compensation forthe energy they produce. In Texas’ case, energy is the primary means by which the generators make money. There is a difference though between generator income, which occurs in the present, and the capacity market, which is a type of expected forward compensation. The lack of a capacity market in ERCOT is an important point to note due to the “peaker” impact on market pricing. When energy shortage or near shortage situations occur, various power plants that seldom run are called into action (called “peakers”). Peakers tend to set the marginal price of power in the market when they run. Peakers tend to have higher startup, operational, or overhead costs than cheaper or more efficient baseload plants; these peaker power plant operators target covering their costs based on shorter periods

of operation or generation. Hence, these plants are, in a sense, betting on shortage or near shortage scenarios to meet their financial targets. ERCOT, like many grid operators, run auctions to determine which plants are dispatched and the generators bid at price levels for which they run. As such, peaker plants tend to bid high or higher than other generators to cover their higher cost structures. Peakers, like baseload plants, are not compensated by a capacity market in ERCOT; sales from energy are their main means of revenue. The market structure in ERCOT, leaning on the use of peakers to cover demand/supply equilibrium in times of high demand or periods of shortage, means that energy prices tend to be higher during shortage or near shortage scenarios. Having an energyonly market leaves only one mechanism by which generators in ERCOT can rely on for their financial success, and this market design has a direct impact on the resulting energy prices.In the ERCOT power market, electricity trading is bucketed into peak or offpeak exposure. For “peak hours,” traders agree to buy or sell power for hours ending 7am to 10pm for weekdays for a fixed price with the floating leg settling against the ERCOT published price for the corresponding hours. “Off peak” is generally considered nights and weekends. Power trading for ERCOT is also primarily traded in ones, per the following FERC map,shown in Figure 1 on the next page. �� Fear and Heat in the Texas Power Markets: A TailRisk Example and Perspective GLOBAL COMMODITIES APPLIED RESEARCH DIGEST| Editorial Advisory Board Commentaries| www.jpmccgcard.| Spring 2017 Figure 1Source: FERC. Market liquidity seems to lie in the North Zone (or the area around Dallas). The ERCOT power market trades daily/weekly or monthly products, depending on the activity set of traders andhedger. Market liquidity also seems to increase

as positions approach settlement or delivery.Power is a physical commodity that goes to delivery and is consumed; it is not a commodity that can be readily stored in stockpiles like coal or stored in tanks like oil. As such, when there is not enough power, prices increaseto (usually) balance supply and demand, but as demand does not always react to price, shortages or blackoutsas they are more commonly knownmay result. For reference, wholesale prices for ERCOT are capped at $9,000/MWfor comparison, the average retail price for all market sectors in Texas for 2015 was approximately $87MW. �� Fear and Heat in the Texas Power Markets: A TailRisk Example and Perspective GLOBAL COMMODITIES APPLIED RESEARCH DIGEST| Editorial Advisory Board Commentaries| www.jpmccgcard.| Spring 2017 In summary, regarding the power markets and ERCOT in particular, the background section of this article explained:power is a physical commodity and must be consumed orlost: it cannot be stored;there is no capacity market in ERCOT, thus generators are paid for what they produce in current time; andpeaker unit pricing can significantly drive up power prices in ERCOT as operators attempt to cover costs using these ‘reserve units’; peaker usage may produce spikes in power prices at time of use due to the economics of the plant. With this background in mind, this article will now cover a case study, which brings up important riskmanagement questions and lessons.Case Study from the Summer of 2015June and July of 2015 were shaping up to be fairly benign months. As Figure 2 shows, temperatures had been in the 100s F in both Dallas and Houston, but both North peak settlement prices and load in ERCOTremained far from reaching record levels.Figure 2 Temperatures did reach 103F on July 30, and settlement prices for the day did reach $94/MW (with a peak hourly price of $430/MW) based on an average peak load

for the day of 58.1 gigawatts (GW), wia peak load of 67.6 GW. The price spike was attributed to both heat and a lowerthanaverage wind generation contribution for certain peak hours. The 67.6 GW load for the day was not too far from the previous record load of 68.3 GW on August 3 of 2011but of note, the overall generation capacity available to the grid had increased by about 5 to 6 GW, net of retirements, since August of 2011. �� Fear and Heat in the Texas Power Markets: A TailRisk Example and Perspective GLOBAL COMMODITIES APPLIED RESEARCH DIGEST| Editorial Advisory Board Commentaries| www.jpmccgcard.| Spring 2017 Generally, forward prices for August were flatlining to decreasing since the beginning of June. However, on Friday July 31, the market closed up about $6 or about a 2.2 sigma move, as illustrated in Figure 3.Figure 3 Forecasts were calling for high 90s to low 100 degree temperatures in Texas over the next couple weeks, which is not out of the ordinary for a Texas summer and nothing substantially different than what had been happening during most of July. And then things changed.Over the weekend, when the market was closed, weather models shifted to higher heat in Texas by 2 degrees F, forecasting temperatures up to 105 F in Dallas during various days of the first and second weeks in August. While the actual temperature forecast increase was only a couple degrees warmer, the shift was significant. As temperatures increase, the risk or potential risk of the load surpassing generation also increases. If load exceeds generation, the locational area has a potential for blackouts. As the heat increases, the power load driven by air conditioning demand increases. Generally, air conditioning runs more when it’s very hot outside and power load correspondingly increases.When the market opened on Monday morning, prices for weekly electricity strips (timeframes) gapped

up and settled per Figure 4 on the next page. �� Fear and Heat in the Texas Power Markets: A TailRisk Example and Perspective GLOBAL COMMODITIES APPLIED RESEARCH DIGEST| Editorial Advisory Board Commentaries| www.jpmccgcard.| Spring 2017 Figure 4 The secondweek peak prices gapped up about $45/MWon open and settled from Friday’s close of $55/MW to $185/MW (an approximately 20sigma move) before reaching a peak of $225/MW on August 5. So, prices basically tripled to quadrupled overnight and over a few days, respectively. Bidask spreads had gonefrom the usual dollar to a few dollars per MW wide to, at one point, several hundred dollars per MW wide. The gap up in energy prices can be seen as the expectation that peaker plants would likely be called into action to cover the demand/supply scenarioIn other words, the gap up in market prices signals a shift from more baseload power generation to the usage of more costly peaker units. The prices for the full month of August gapped up from $52/MW to about $99/MW (an approximately sigma move), eventually peaking around $119/MW, as seen in Figure 5 on the next page. �� Fear and Heat in the Texas Power Markets: A TailRisk Example and Perspective GLOBAL COMMODITIES APPLIED RESEARCH DIGEST| Editorial Advisory Board Commentaries| www.jpmccgcard.| Spring 2017 Figure 5 As a risk manager, pricegap scenarios are obviously a difficult situation, if not impossible to address, at the time of the market move. While it is no secret that the ERCOT market has the potential to make these types of price moves (after all, it does get hot in Texas during the summer and people do run their air conditioners), traditional risk measure and models such as ValueRisk (VaR) are not intended or designed to provide risk measures for this type of pricegap scenario. Most users of VaR employ a 95% or a 99.5% confidence interval based upon historic f

orward price volatilities and correlations. None of those measures, which are used to produce ranges of potential outcomes, would have been useful for forecasting what actually happened in the ERCOT market during the summer of 2015.Unfortunately, a risk manager cannot use option market data as a predictor for market volatility since the availability of option price data is limited. The option market is not very transparent as it trades primarily OTC and as a result, insight or transparency into implied volatility is limited. The available data did suggest an annualized forward implied volatility, which even at a three sigma move, would still leave the estimate of possible outcomes far short of the actual market outcome at the time. In other words, the other market data that could provide a signal of some expected price jump or volatility was not signaling a jump either. The AftermathOutright temperatures in Dallas and in Houston exceeded the 105F mark during that second week of August. The ERCOT North Hub peak prices, load,and temperatures of the time are shown on Figure 6 on the next page. �� Fear and Heat in the Texas Power Markets: A TailRisk Example and Perspective GLOBAL COMMODITIES APPLIED RESEARCH DIGEST| Editorial Advisory Board Commentaries| www.jpmccgcard.| Spring 2017 Figure Peak prices for daily power rose to the $140/MW range in the second week of August, and the week averaged $86/MW. Peak power for the month finished with an average of about $46/MW, far from the peak that power traded at during thfirst few days in August (at/near $140/MW). Note that all power prices in this region decreased considerably from the highs that occurred during the initial “shock” period. Power prices are generally meanreverting over time, but the difficulty for the risk manager is figuring the length of the meanreversion process. An interesting point is illustrated in Fig

ure 6, concerning August 13, when prices spiked while temperatures were down from the high and down from the previous day. This unexpected price spike is believed to be due to the volume of wind generation contribution to the grid being far less than anticipated (which is similar to what happened on July 30), leading to the use of higher priced peaker plants. Loss of wind generation capacity cansubstantially alter the demand/supply equilibrium, invoking peaker usage and subsequent higher energy prices. �� Fear and Heat in the Texas Power Markets: A TailRisk Example and Perspective GLOBAL COMMODITIES APPLIED RESEARCH DIGEST| Editorial Advisory Board Commentaries| www.jpmccgcard.| Spring 2017 Lessons Learned From a risk perspective, managing extreme tail risk in ERCOT can be quite challenging:the market can gap on openand bidoffers can widen (which does not generally appear in traditional risk models);the market can move faster than traders can respond;stoploss limits can be hit during market gaps; andtraders may try to hold rapidly losing positions and attemptto withstand the price jump (since they assuma mean reversion in price will eventually occur), and in the meantime, stressing previously established risk limits.In theory, traders should be able to short a market to take advantage of situationswhere they believe the market to be overvalued. However, taking short positions into summer or winter in ERCOT exposes positions to extreme tail risk (or market gap pricing). While not the subject of this article, ERCOT on occasion has had moments during the winter where extremely cold weather has led to spikes in gas prices. During extremely cold weather, there can be freezeoffs on gas wells and gas distribution systems (which produce a lack of natural gas on the market). At the same time, there would behigh demand for residential/commercial heating, which wouldcompetwith fuel for p

ower plants.All these factors taken together can then led to price spikesin the winterSo how does a risk manager ensure an ERCOT trader is allowed room to operate and take short positions without putting a whole company at risk? In short, a risk manager must correspondingly ensure that a single position loss is not greater than the company can sustain. There are several methods to attempt to mitigate an extreme financial loss to the company when exposed to periods of extreme tail risk, including:setting seasonal short position limits for positions carried over a weekend;attempting to quantify the real risk taken by a trader during these periods;quantifying holding periods or loss levels for carrying positions over gap periods to try to capture market mean reversion; orsetting aside a financial pool or reserve to cover gap pricing risk due to extreme tail events.A rational approach to managing Monday market gaps is to set seasonal short position limits on positions carried over the weekend when the market is dormant. Weekend position limits are a simple approach to help mitigate this type of tail risk. Finding the volume limit is an exercisein management decisionmaking. For instance, limit the trader to short no more than 500 MWs during the summer in ERCOT over the weekend. In terms of dollars, on a monthly peak power basis, the 500 MWs would equate to approximately an $8 million dollar loss in this scenario (500MW x 21 peak days x 16 peak hours/day x $47 price move). If this loss is unpalatable to management, then lower the volume limit. Trading management should be very aware of gap pricing risk during these potentially high volatility �� Fear and Heat in the Texas Power Markets: A TailRisk Example and Perspective GLOBAL COMMODITIES APPLIED RESEARCH DIGEST| Editorial Advisory Board Commentaries| www.jpmccgcard.| Spring 2017 seasons, and risk managers should peg short position

limits to potential pricegap scenarios. If the potential dollar loss of a gaprisk scenario is unappealing, then one may want to consider not taking short positions at all or limiting shorts to just daily orweekly products for instance. But with the $9,000/MW cap in mind, even taking a 100 MW short at $100 into a peak oneday market equates to a loss of $14 million ($9000$100 * 16 hours * 100 MW = $14.2 million) in a worstcase scenario. While the $9000 cap is quite unlikely to be reached and quite unlikely to last for an extended period (since one of the primary roles of the Independent System Operator is to maintain reliability and prevent such scenarios), shorting power in ERCOT can obviously be quite a dangerous proposition. One small volume position taken by a trader could cause the financial stoploss limit of the whole book to be triggered. A second approach to protect against a severe move is to try to quantify the real risk being taken by a trader. One might (a) use scenario analysis or stress tests, (b) modify VaR for bidask spreads or liquidity, or (c) adjust VaR volatilities for jumps in order to improve the quantification of the risk of short nearterm ERCOT positions. There is a counter argument to this approach: these methods will likely result in a VaR type calculation or risk figure that is far greater than a trader or firm’s limit. The result of these calculations may be that a trader is restricted from any short trades at all. ConclusionThe best way to protect against a severe price move may be to adopt one of the following approaches: (1) take a dollar reserve against a tail move, (2) limit the positions that can be taken, (3) restrict carrying positions over the weekend, or (4) simply do not trade this market during the seasons of extreme weather patterns. Restricting short positions during seasons of extreme weather patterns will be unpopular with traders and may s

ignificantly impact the flexibility of the trader toexploitopportunities in the marketbut in the long term this may lead to a more sustainable business model. A final interesting point is that the market reacted quite bullishly to the forecasted weatherchange in the beginning of August 2015, yet prices actually settled not far from where they were prior to that initial jump. In this case, the fear of the grid being overloaded was far from the reality. While it can be difficult to swallow markmarket losses on a short position going into an extremeprice move, holding the short through the potential weather shockin retrospect would have been far better than exiting othe initial run upin this particular case study Endnoteshttps://www.ferc.gov/marketoversight/mktelectric/texas/electexasglance.pdfhttp://www.eia.gov/state/rankings/?sid=TX#series/51https://www.ferc.gov/marketoversight/mktelectric/texas/2007/012007elecarchive.pdf via Platts PowerMaphttps://www.puc.texas.gov/agency/rulesnlaws/subrules/electric/25.505/25.505.pdf �� Fear and Heat in the Texas Power Markets: A TailRisk Example and Perspective GLOBAL COMMODITIES APPLIED RESEARCH DIGEST| Editorial Advisory Board Commentaries| www.jpmccgcard.| Spring 2017 http://www.eia.gov/electricity/data/browser/#/topic/7?agg=0,1&geo=0000000002&endsec=g&linechart=ELEC.PRICE.USALL.A~ELEC.PRICE.USRES.A~ELEC.PRICE.USCOM.A~ELEC.PRICE.USIND.A&columnchart=ELEC.PRICE.USALL.A~ELEC.PRICE.USRES.A~ELEC.PRICE.USCOM.A~ELEC.PRICE.USIND.A&map=ELEC.PRICE.USALL.A&freq=A&start=2001&end=2015&ctype=linechart<ype=pin&rtype=s&maptype=0&rse=0&pin=ELEC.PRICE.USALL.A~ELEC.PRICE.USRES.A~ELEC.PRICE.USCOM.A~ELEC.PRICE.USIND.A~ELEC.PRICE.USTRA.A~ELEC.PRICE.USOTH.Ahttp://www.ercot.com/news/press_releases/show/73057Courtesy of Intercontinental ExchangeCourtesy ERCOTThe author would like to express appreciation for the editorial and research assistance from Leslie McNew,

Dillon Klein and Zach Carter.Although the author has made every effort to ensure that the information in this article was correct at time of writing, the author does not assume and hereby disclaims any liability to any party for any loss, damage, or disruption caused by errors or omissions, whether such errors or omissions result from negligence, accident, or any other cause. This article was prepared by the author in his personal capacity. The opinions expressed in this article are the author's owand do not reflect the view of the author’s employer or of the University of Colorado Denver Business School.Author BiographPETER O’NEILL, CFAChief Risk Officer and Head of Finance, Uniper Global Commodities North Americaand Editorial Advisory Board Member, Global Commodities Applied Research DigestPeter O’Neill is Chief Risk Officer and Head of Finance, Uniper Global Commodities North America a whollyowned subsidiary of Uniper SE, the Germanbased, independent power producer. He is responsible for implementing risk management strategy, valuationand quantitative methods, insurance and for overseeing the controls for the North American Gas and Power trading functions.In addition to therisk management responsibilities, he manages financial reporting and accounting, billing and settlements, treasury and working capital management and budgeting and forecasting. Prior to working for Uniper, Peter ran the global energy marketing risk team for BG Group in Houston and worked in various risk roles of BP’s Integrated Supply and Trading, which included a twoyear assignment with TNKBP in Moscow. Peter received his M.B.A. in Finance from the AB Freeman School of Business, Tulane University in New Orleans, and received his B.S. in Chemical Engineering from the University of Notre Dame.He sits on various academic and industry boards that relate to risk management, trading, commodities, and student de