/
F igure  2 : Column type for the study area and corresponding well log response showing F igure  2 : Column type for the study area and corresponding well log response showing

F igure 2 : Column type for the study area and corresponding well log response showing - PowerPoint Presentation

deena
deena . @deena
Follow
27 views
Uploaded On 2024-02-02

F igure 2 : Column type for the study area and corresponding well log response showing - PPT Presentation

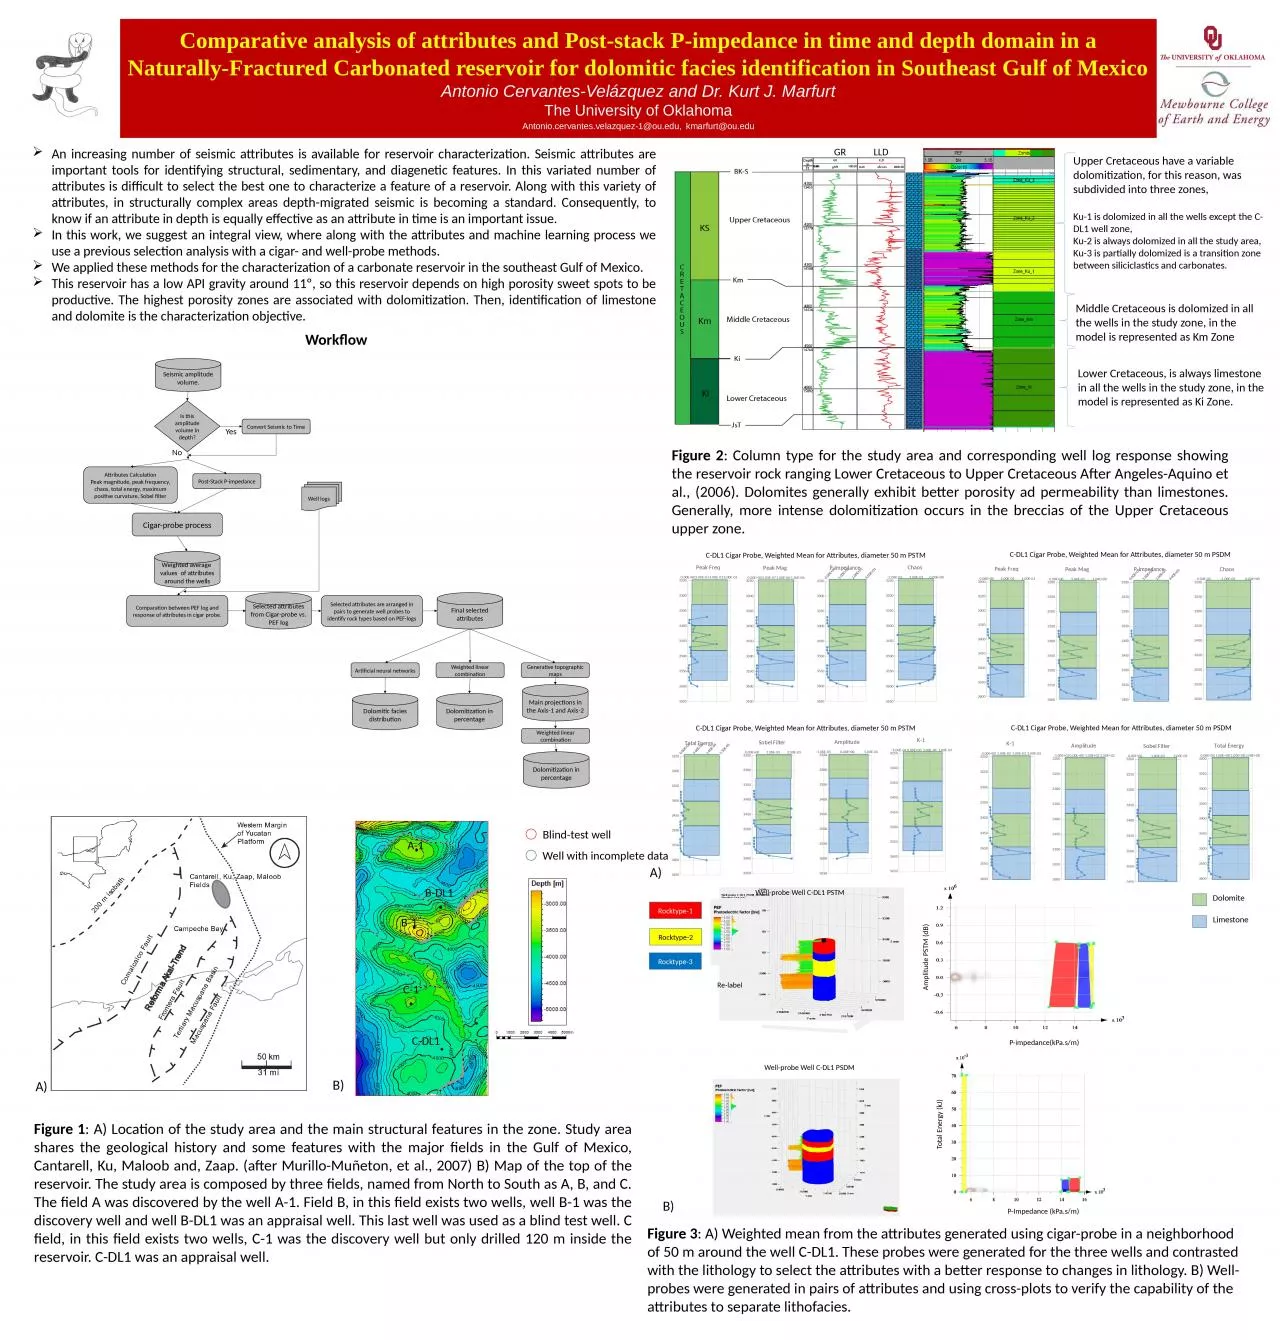
F igure 1 A Location of the study area and the main structural features in the zone Study area shares the geological history and some features with the major fields in the Gulf of Mexico Cantarell ID: 1043546

zone attributes probe dl1 attributes zone dl1 probe limestone test dolomized reservoir dl1a cigar section weighted blind response wells

Share:

Link:

Embed:

Download Presentation from below link

Download Presentation The PPT/PDF document "F igure 2 : Column type for the study a..." is the property of its rightful owner. Permission is granted to download and print the materials on this web site for personal, non-commercial use only, and to display it on your personal computer provided you do not modify the materials and that you retain all copyright notices contained in the materials. By downloading content from our website, you accept the terms of this agreement.


Presentation Transcript

1. Figure 2: Column type for the study area and corresponding well log response showing the reservoir rock ranging Lower Cretaceous to Upper Cretaceous After Angeles-Aquino et al., (2006). Dolomites generally exhibit better porosity ad permeability than limestones. Generally, more intense dolomitization occurs in the breccias of the Upper Cretaceous upper zone.Figure 1: A) Location of the study area and the main structural features in the zone. Study area shares the geological history and some features with the major fields in the Gulf of Mexico, Cantarell, Ku, Maloob and, Zaap. (after Murillo-Muñeton, et al., 2007) B) Map of the top of the reservoir. The study area is composed by three fields, named from North to South as A, B, and C. The field A was discovered by the well A-1. Field B, in this field exists two wells, well B-1 was the discovery well and well B-DL1 was an appraisal well. This last well was used as a blind test well. C field, in this field exists two wells, C-1 was the discovery well but only drilled 120 m inside the reservoir. C-DL1 was an appraisal well.Figure 3: A) Weighted mean from the attributes generated using cigar-probe in a neighborhood of 50 m around the well C-DL1. These probes were generated for the three wells and contrasted with the lithology to select the attributes with a better response to changes in lithology. B) Well-probes were generated in pairs of attributes and using cross-plots to verify the capability of the attributes to separate lithofacies.Comparative analysis of attributes and Post-stack P-impedance in time and depth domain in a Naturally-Fractured Carbonated reservoir for dolomitic facies identification in Southeast Gulf of MexicoAntonio Cervantes-Velázquez and Dr. Kurt J. MarfurtThe University of OklahomaAntonio.cervantes.velazquez-1@ou.edu, kmarfurt@ou.eduAn increasing number of seismic attributes is available for reservoir characterization. Seismic attributes are important tools for identifying structural, sedimentary, and diagenetic features. In this variated number of attributes is difficult to select the best one to characterize a feature of a reservoir. Along with this variety of attributes, in structurally complex areas depth-migrated seismic is becoming a standard. Consequently, to know if an attribute in depth is equally effective as an attribute in time is an important issue.In this work, we suggest an integral view, where along with the attributes and machine learning process we use a previous selection analysis with a cigar- and well-probe methods. We applied these methods for the characterization of a carbonate reservoir in the southeast Gulf of Mexico.This reservoir has a low API gravity around 11º, so this reservoir depends on high porosity sweet spots to be productive. The highest porosity zones are associated with dolomitization. Then, identification of limestone and dolomite is the characterization objective.A-1B-1B-DL1C-1C-DL1Blind-test wellWell with incomplete dataGRLLDLower Cretaceous, is always limestone in all the wells in the study zone, in the model is represented as Ki Zone.Middle Cretaceous is dolomized in all the wells in the study zone, in the model is represented as Km ZoneUpper Cretaceous have a variable dolomitization, for this reason, was subdivided into three zones,Ku-1 is dolomized in all the wells except the C-DL1 well zone,Ku-2 is always dolomized in all the study area,Ku-3 is partially dolomized is a transition zone between siliciclastics and carbonates.C-DL1 Cigar Probe, Weighted Mean for Attributes, diameter 50 m PSTMC-DL1 Cigar Probe, Weighted Mean for Attributes, diameter 50 m PSTMC-DL1 Cigar Probe, Weighted Mean for Attributes, diameter 50 m PSDMC-DL1 Cigar Probe, Weighted Mean for Attributes, diameter 50 m PSDMP-impedance(kPa.s/m)Amplitude PSTM (dB)A)B)B)A)DolomiteLimestoneWell-probe Well C-DL1 PSTMPEFRe-labelRocktype-1Rocktype-2Rocktype-3Seismic amplitude volume.Attributes CalculationPeak magnitude, peak frequency, chaos, total energy, maximum positive curvature, Sobel filterWeighted average values of attributes around the wellsWell logsPost-Stack P-impedanceCigar-probe processComparation between PEF log and response of attributes in cigar probe.Selected attributes are arranged in pairs to generate well probes to identify rock types based on PEF-logsSelected attributes from Cigar-probe vs. PEF logFinal selected attributesIs this amplitude volume in depth?Convert Seismic to TimeYesNoArtificial neural networksWeighted linear combinationGenerative topographic mapsDolomitic facies distributionDolomitization in percentageDolomitization in percentageWeighted linear combinationMain projections in the Axis-1 and Axis-2WorkflowWell-probe Well C-DL1 PSDMP-Impedance (kPa.s/m)Total Energy (kJ)

2. Figure 4: Three values were assigned to the different responses observed from the weighted averages, 1 for a remarkable response, 0.5 for mild response and 0 for no visible response. A) In this table, the results for PSDM are presented. B) The attributes from PSTM showed a better response to the lithological changes. Amplitude, total energy, and P-impedance were selected for machine learning processes. Figure 6:Result for ANN in PSTM ANN looks no working well for the classification. It shows dolomitization in some parts of the Ki zone as the syncline between A-1 and B-1 and in the zone of C-1. For the blind-test well, ANN looks working relatively well. ANN was capable to identify dolomitization zone and the little limestone zone in the lower part of the well, that changes to dolomite again in the bottom of the well. B) For weighted linear combination, the result is much better. WLC covered all the premises. Units Ku-3 and Ku-2 are always dolomized, the Ku-1 unit is not dolomized in the well C-DL1 area and, Ki unit is never dolomized, except in the syncline between field B and field C. The response in the blind test well was good too. WLC covered the premises and was able to identify the limestone body in the lower part of the well. C) For GTM/WLC, we obtained an acceptable result, where almost all the premises were accomplished. The only zone with issues was zone Ku-1, wherein the well C-DL1 is not completely limestone. For the area of the blind-test well is not bad, but it wasn’t able to identify the limestone in the lower part of the well.Figure 5: Result for ANN process in the PSDM attributes. The result covered some of the premises, such as Ku-3 and Ku-2 zones dolomized. K-1 unit is dolomized also, but the limestone body in the zone of C-DL1 it wasn’t identified. The result of the test well wasn't good. ANN showed, almost, all the zone dolomized. For the WLC, PSDM covered almost all the premises. For the C-DL1 zone, the limestone in the third unit was identified For the test-well all the zone near was dolomized, and the limestone in the lower part was not identified. We apply WLC over the axis projections from GMT. The only premise that is not completely accomplished is the limestone in the unit Ku-1. For the test well zone, the transition between the dolomite from Km and, limestone from Ki was well delimited. But it was not able to identify the limestone in the lower part of the well.Comparative analysis of attributes and Post-stack P-impedance in time and depth domain in a Naturally-Fractured Carbonated reservoir for dolomitic facies identification in Southeast Gulf of MexicoAntonio Cervantes-Velázquez and Dr. Kurt J. MarfurtThe University of Oklahomarlima@ou.edu, kmarfurt@ou.eduSpectral AttributesGeometric AttributesSeismic InversionWellPeak FreqPeak MagChaosTotal EnergyMaximum positive CurvatureSobel FilterP-ImpedanceAmplitudeA-10.5110.50110.5B-100011001C-DL11110.51111Total1.52222222.5Spectral AttributesGeometric AttributesSeismic InversionWellPeak FreqPeak MagChaosTotal EnergyMaximum positive CurvatureSobel FilterP-ImpedanceAmplitudeA-11110.51111B-10.50.50.50.50.5011C-DL111111111Total2.52.52.522.5233B)A)ReferencesAngeles-Aquino, Francisco J. “Monografia Petrolera De La Zona Marina. IN SPANISH. Monograph Of The Marine Zone Oil.” Boletin de La Asociacion Mexicana de Geologos Petroleros, 2006, p. 69.Murillo-Muñetón, G., et al. “Stratigraphic Architecture and Sedimentology of the Main Oil-Producing Stratigraphic Interval at the Cantarell Oil Field: The K/T Boundary Sedimentary Succession.” Proceedings of the SPE International Petroleum Conference and Exhibition of Mexico, 2002, pp. 643–49, doi:10.2118/74431-MS.Roy, Atish, et al. “Generative Topographic Mapping for Seismic Facies Estimation of a Carbonate Wash, Veracruz Basin, Southern Mexico.” Interpretation, vol. 2, no. 1, 2014, pp. SA31-SA47, doi:10.1190/INT-2013-0077.1.Acknowledgments: Cigar-probe, Peak frequency, Peak Magnitude, Chaos, Total Energy, Maximum positive curvature, Sobel Filter and Generative Topographic Mapping were generated using AASPI. P-impedance was generated with Geoview. Well-probe, artificial neural network, weighted linear combination, 3D visualization and cross-sections were generated using Petrel by Schlumberger. This research is supported by Pemex Exploration and Production Co. We would also like to show our gratitude to the National Council of Science and Technology (CONACyT) for the scholarship awarded under contract with the Energy Bureau of Mexico (Sener). We want to show appreciation to the AASPI Consortium for advising and proving license of AASPI software. We are also immensely grateful to Schlumberger for providing licenses for Petrel to OU for use in research and education. A-1B-1B-DL1C-1C-DL1A-1B-1B-DL1C-1C-DL1A-1B-1B-DL1C-1C-DL1A-1B-1B-DL1C-1C-DL1A-1B-1C-1C-DL1A-1B-1C-1C-DL1A-1B-1C-1C-DL1B-1B-DL1B-1B-DL1B-1B-DL1A-1B-1C-1C-DL1B-1B-DL1A-1B-1C-1C-DL1A-1B-1C-1C-DL1B-1B-DL1B-1B-DL1ANNWLCGTM/WLCANNWLCGTM/WLCRegularPoorGOODRegularCross-section through the wells PSTMCross-section through the blind-test well PSTMCross-section through the wells PSDMCross-section through the blind-test well PSDMBADRegularCross-section showing the zones in the wellsCross-section showing the zones in the blind-test wellCross-section showing the zones in the wellsCross-section showing the zones in the blind-test well