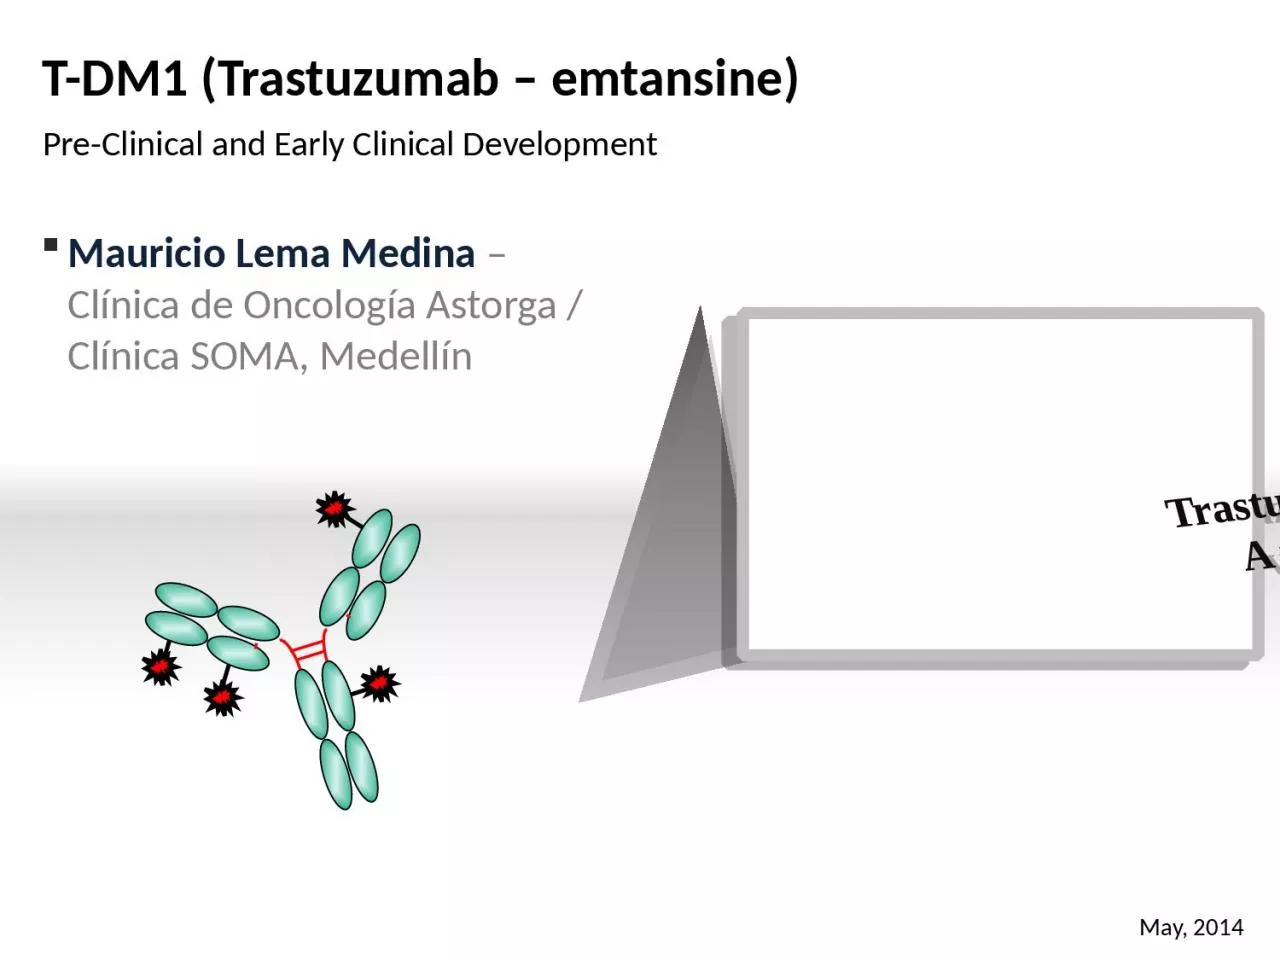
/
Mauricio Lema Medina  – Clínica de Oncología Astorga / Clínica SOMA, Medellín Mauricio Lema Medina  – Clínica de Oncología Astorga / Clínica SOMA, Medellín

Mauricio Lema Medina – Clínica de Oncología Astorga / Clínica SOMA, Medellín - PowerPoint Presentation

delcy
delcy . @delcy
Follow
27 views
Uploaded On 2024-02-09

Mauricio Lema Medina – Clínica de Oncología Astorga / Clínica SOMA, Medellín - PPT Presentation

Trastuzumabemtansine A very nice poison TDM1 Trastuzumab emtansine PreClinical and Early Clinical Development May 2014 Overview Anti HER2 therapy in mBC ID: 1045527

her2 dm1 adc trastuzumab dm1 her2 trastuzumab adc cancer treatment months patients emilia study prior pfs positive grade mbc

Share:

Link:

Embed:

Download Presentation from below link

Download Presentation The PPT/PDF document "Mauricio Lema Medina – Clínica de On..." is the property of its rightful owner. Permission is granted to download and print the materials on this web site for personal, non-commercial use only, and to display it on your personal computer provided you do not modify the materials and that you retain all copyright notices contained in the materials. By downloading content from our website, you accept the terms of this agreement.


Presentation Transcript

1. Mauricio Lema Medina – Clínica de Oncología Astorga / Clínica SOMA, MedellínTrastuzumab-emtansine: A very nice poisonT-DM1 (Trastuzumab – emtansine)Pre-Clinical and Early Clinical DevelopmentMay, 2014

2. OverviewAnti HER2 therapy in mBC – A bird’s eye viewIntroduction to Antibody Drug Conjugates (ADCs) Modes of ADC toxicityT-DM1 pre-clinical developmentT-DM1 early clinical developmentConcluding remarks2

3. Slamon DJ, Science 235: 177-182, 1987DFSOSHuman Breast Cancer: Correlation of Relapse and Survival with Amplification of the HER-2/neu Oncogene

4. 12Downstream signaling pathwaysCell proliferation Cell survival211TrastuzumabTErb receptorsMechanism of Action of TrastuzumabTrastuzumab:Inhibits ligand-independent HER2 signalingActivates ADCCPrevents HER2 ECD shedding

5. Trastuzumab with chemotherapy in HER2 postive MBCDesign and enrolmentNo prior anthracyclinesPrior anthracyclinesPaclitaxel(n=96)Trastuzumab + paclitaxel(n=92)AC(n=138)Trastuzumab + AC(n=143) Metastatic breast cancer HER2 overexpression 2/3+ No prior CT for MBC Measurable disease KPS ³60%Eligible patients (n=469)AC = doxorubicin/epirubicin + cyclophosphamideSlamon DJ et al. N Engl J Med 2001;344:783

6. P< 0.001Trastuzumab + AC (N=143)AC (N=138)MonthsP< 0.001Trastuzumab + Paclitaxel (N=92)Paclitaxel (N=96)Months1.00.80.60.40.20.00 5 10 15 20 25 30Proportion ofProgression-Free Survival1.00.80.60.40.20.00 5 10 15 20 25ACPaclitaxel* Median follow-up: 35 mo (range: 30–51)..Trastuzumab Combination Pivotal Trial: Subgroup Analysis–TTP*Slamon. N Engl J Med. 2001;344:783.

7. CT patients treated withtrastuzumab after disease 24% 62% 65% 72%progression1.00.80.60.40.200 5 15 25 35 45H + CTCTProbability of survival25.1 months (­20%)20.3 monthsHR=0.80p=0.046Time (months)Slamon DJ et al. N Engl J Med 2001;344:783Overall survival

8. Slamon et al. N Engl J Med. 2001;344:783-792.Enrolled, nResponse Rate, % (% Improvement)Response Duration, Mos (% Improvement)Time to Progression, Mos (% Improvement)H + CT23549 (-53%)9.3 (-58%)7.6 (-65%)CT234325.9 4.6H + AC13852 (-20%)9.1 (-40%)8.1 (-33%)AC145436.56.1H + T9242 (-163%)11.0 (-150%)6.9 (-130%)T96164.43.0QT vs QT+Trastuzumab

9. Cardiac Dysfunction Associated With TrastuzumabSeidman A, et al. J Clin Oncol. 2002;20:1215-1221. Trastuzumab AloneTrastuzumab+ ACACAloneTrastuzumab+ PaclitaxelPaclitaxelAloneAny3% to 7%27%8%13%1%Class III-IV2% to 4%16%4%2%1%

10. There is significant reversibility of LV dysfunction with trastuzumab-related cardiac toxicityEwer, et al J of Clinical Oncology 2005,23;p 7820-6.

11. HER2-positive MBC (IHC 3+ and/or FISH+) n=188Docetaxel*100mg/m2 q3w x 6Docetaxel100mg/m2 q3w x 6Trastuzumab®4mg/kg loading, 2mg/kg weekly until PD+*Patients progressing on docetaxel alone could crossover to receive Herceptin® Two patients did notreceive study medication n=92n=94Study M77001 was conducted to demonstrate the activity of Trastuzumab plus docetaxelMarty M, et al. J Clin Oncol 2005;23:4265

12. Extra 2005; Marty et al 2005Twice as many patients receiving trastuzumab survived 3 years (33% vs 16%)Trastuzumab + docetaxel (n=92)Docetaxel alone (n=94)Patients alive (%)22.731.202040608010005101520253035504045+37%Months8.5 monthsM77001: OS (IHC 3+ / FISH+)p=0.0325p=0.0325**Statistically significant difference

13. 12Downstream signaling pathwaysCell proliferation Cell survival2112TrastuzumabTLapatinibLLLLLLErb receptorsMechanism of Action of LapatinibCompared to Trastuzumab

14. EGF100151 study design1,2 Treatment continued until progression or unacceptable toxicityPatients with ErbB2-positive locally advanced or metastatic breast cancer that progressed after prior anthracycline, taxane and trastuzumab(N=399)RANDOMISATION1. Cameron D et al. Breast Cancer Res Treat 2008; 2. Geyer GE et al. N Engl J Med 2006Lapatinib 1250 mg po od continuously + capecitabine 2000 mg/m2/d po days 1-14 q 3 wk Capecitabine 2500 mg/m2/day po days 1-14 q 3 wkpo = oral; od = once daily; q 3 wk = once every 3 weeks

15. EGF100151: independently assessed time to progression1

16. Trastuzumab + Paclitaxel.2001Phase IIITrastuzumab + Docetaxel2005Phase IILapatinib + Capecitabina2006Phase IIISlamon DJ, et al. (2001) N Engl J Med 344:783–792.Marti M, et al. J Clin Oncol 23:4265–4274.Geyer, et al. NEJM, 2006 1st-lineLapatinib + Capecitabine after Taxane + Trastuzumab: One approach on progression2nd--line

17. Pertuzumab and Trastuzumab: Complementary Mechanisms of ActionHER1/3/4PertuzumabHER2TrastuzumabSubdomain IVDimerization domainTrastuzumab:Inhibits ligand-independent HER2 signalingActivates ADCCPrevents HER2 ECD sheddingPertuzumab:Inhibits ligand-dependent HER2 dimerization and signalingActivates ADCCADCC = antibody-dependent cell-mediated cytotoxicity; ECD = extracellular domain

18. CLEOPATRA Study DesignBaselga J et al. N Engl J Med 2012;366(2):109-19. Centrally confirmed HER2-positive locally recurrent, unresectable or metastatic BC (mBC)≤1 hormonal regimen for mBCPrior (neo)adjuvant systemic rx, incl trastuzumab and/or taxane allowed if followed by DFS ≥12 moBaseline LVEF ≥ 50%; no CHF or LVEF < 50% during or after prior trastuzumabTrastuzumabDocetaxel (≥6 cycles recommended)TrastuzumabDocetaxel (≥6 cycles recommended)PlaceboPertuzumab1:1N = 406N = 402RPrimary endpoint: Independently assessed progression-free survival

19. Baselga J et al. N Engl J Med 2012;366(2):109-119.CLEOPATRA: Progression-Free SurvivalIndependently assessedPertuzumab(n = 402)Control(n = 406)HRp-valueMedian PFS18.5 mo12.4 mo0.62<0.001

20. CLEOPATRA: Significant improvement in median PFS1,2 (and OS)3 with pertuzumabD, docetaxel; Ptz, pertuzumab; T, trastuzumab 05101520253035400102030405060708090100PFS time (months)HR = 0.6295% CI 0.51, 0.75p < 0.00112.418.5 Independently-assessed PFS (%)Number at risk40234526713983321000Ptz+T+D406311209934217700Pla+T+DPtz+T+DPla+T+D1. Baselga J, et al. SABCS 2011 (Abstract S5-5);2. Baselga J, et al. N Engl J Med 2012; 366: 109–119;3. Swain S, et al. SABCS 2012 (Poster P5-18-26). 3

21. Baselga J et al. N Engl J Med 2012;366(2):109-119.CLEOPATRA: Overall Survival (Interim Analysis)Pertuzumab(n = 402)Placebo(n = 406)HRp-valueDeaths*17.2%23.6%0.640.005* Did not meet the O’Brien-Fleming stopping boundary of the Lan-DeMets alpha spending function for this interim analysis of overall survival and was therefore not significant.

22. Select adverse events (Grade ≥3)Pertuzumab(n = 407)Placebo(n = 397)Neutropenia48.9%45.8%Febrile neutropenia13.8%7.6%Leukopenia12.3%14.6%Diarrhea7.9%5.0%Peripheral neuropathy2.7%1.8%Left ventricular systolic dysfunction1.2%2.8%Baselga J et al. N Engl J Med 2012;366(2):109-19. CLEOPATRA: Safety Results

23. PertuzumabPlaceboLVSD (any grade)(n = 407, 397)4.4%8.3%Symptomatic LVSD (Grade ≥3) (n = 407, 397)1.0%1.8%LVEF decline to <50% and by ≥10% points from baseline (n = 393, 379)3.8%6.6%Ewer M et al. Proc ASCO 2012;Abstract 533. LVSD = left ventricular systolic dysfunction; LVEF = left ventricular ejection fractionCLEOPATRA: Cardiac Tolerability of Pertuzumab plus Trastuzumab plus Docetaxel in Patients with HER2-Positive mBC

24. Trastuzumab + Paclitaxel.2001Phase IIITrastuzumab + Docetaxel2005Phase IILapatinib + Capecitabina2006Phase IIISlamon DJ, et al. (2001) N Engl J Med 344:783–792.Marti M, et al. J Clin Oncol 23:4265–4274.Geyer, et al. NEJM, 2006 Baselga, et al. NEJM, 2012Verma, et al. NEJM, 20121st-lineLapatinib + Capecitabine after Taxane + Trastuzumab: One approach on progressionPertuzumab +Trastuzumab + Docetaxel2012T-DM120122nd--linePhase IIICLEOPATRAPhase IIIEMILIA

25. Line of CTTotal N% receiving CTMedian duration of CT158100%9.0 mo24476%5.1 mo34069%6.3 mo43052%4.7 mo52440%4.0 mo61933%4.2 moSeah DS et al. Proc ASCO 2012;Abstract 6089.Percentage of Patients with HER+ mBC Receiving nth Line of Chemotherapy (CT) and Duration of CT by Line of TreatmentRetrospective Medical Record Review of 207 Women at DFCI 2005-2008

26. Anatomy of an Antibody-Drug Conjugate (ADC)Antibody targeted to tumorVery potentchemotherapeutic drugTubulin polymerization inhibitorsMaytansines (DM1, DM4)Auristatins (MMAE, MMAF)DNA damaging agentsCalicheamicinsDuocarmycinsAnthracyclines (doxorubicin)Humanized monoclonal Ab (IgG1)mAb with Fc modifications (modulate ADCC, CDC activity)Other mAb fragments26Linker stable in circulationLinker biochemistryAcid labile (hydrazone)Enzyme dipeptides (cleavable) Thioether (uncleavable)Hindered disulfide (uncleavable)Site of conjugationFc, HC, LC

27. Trastuzumab Emtansine (T-DM1): Mechanism of ActionHER2Adapted from LoRusso PM, et al. Clin Cancer Res 2011.NucleusTrastuzumab-specific MOAAntibody-dependent cellular cytotoxicity (ADCC)Inhibition of HER2 signalingInhibition of HER2 sheddingPPP

28. Trastuzumab Emtansine (T-DM1): Mechanism of ActionEmtansine releaseInhibition of microtubule polymerizationInternalizationHER2Adapted from LoRusso PM, et al. Clin Cancer Res 2011.T-DM1LysosomeNucleusPPPTrastuzumab-specific MOAAntibody-dependent cellular cytotoxicity (ADCC)Inhibition of HER2 signalingInhibition of HER2 shedding

29. Improving the Therapeutic WindowDRUG DOSETOXIC DOSE (MTD)EFFICACIOUS DOSE (MED)Therapeutic WindowTherapeutic WindowTOXIC DOSE (MTD) EFFICACIOUS DOSE (MED)ChemotherapyADCMTD: Maximum tolerated dose; MED: Minimum Efficacious DoseADCs can selectively deliver a potent cytotoxic drug to tumor cells via tumor-specific and/or over-expressed antigensIncrease drug delivery to tumorReduce normal tissue drug exposure29

30. ADC Better Tolerated than Free Cytotoxin in Rats30Free DM1 (2400 µg DM1/m²)Early mortality (100%)T-DM1 (2040 µg DM1/m²)Body Weight(% change from baseline)Time (Day)Single IV dose; ratsT-DM1: Trastuzumab emtansine

31. Modes of Anti-tumor Activity of ADCsTumor cytotoxicity is target-directed ADC-Ag binding → internalization in lysosomes → ADC degradation → release of toxin intracellularly → tumor cell death Tumor CellTumor CellsTumor cytotoxicity is target-enhanced (bystander effect) ADC-Ag binding → extracellular cleavage of toxin → release of toxin in local tumor environment → diffusion of toxin intracellularly to neighboring tumor cells → tumor cell death 31

32. Tissue Antigen Characteristics Are Key in ADCs Careful selection of target antigens are an important criterion for both the safety and efficacy of an ADCThe ‘ideal’ tissue antigen should have:High level of target expression in cancer cellsLittle to no expression in normal cells Expressed on the cell surfaceReadily internalizedNo shedding into the blood by cleavage of the antigen from cancer cell surface The number of antigen molecules and antibody binding affinity for the antigen may affect the potency of the ADC32

33. Unwanted ADC-mediated cytotoxicityTargeted binding to normal tissues expressing antigenOff-target (cross reactive) binding to normal tissues Non-antigen-mediated ADC uptake (e.g., Fc-mediated uptake, pinocytosis)Systemic release of toxin Instability of linkerCatabolism of ADC+Modes of Toxicity of ADCsNormal Cell33

34. Unwanted ADC-mediated cytotoxicityTargeted binding to normal tissues expressing antigenOff-target (cross reactive) binding to normal tissues Non-antigen-mediated ADC uptake (e.g., Fc-mediated uptake, pinocytosis)Systemic release of toxin Instability of linkerCatabolism of ADC+Modes of Toxicity of ADCsNormal Cell34

35. Slower Drug Deconjugation With Uncleavable Linker35Polson, et al., Cancer Res., 69(6), 2009Days post doseConcentration (µg/ml)Single IV dose 20 mg/kg ADCUncleavablelinkerCleavable linkerTotal Ab

36. More Stable Linker Reduces Systemic Toxicity of ADC in Rats36Polson, et al., Cancer Res., 69(6), 2009Change in bodyweight (grams)Days post doseSingle IV dose given on Day 1 :CD22-DM1 with cleavable linker

37. More Stable Linker Reduces Systemic Toxicity of ADC in Rats37Polson, et al., Cancer Res., 69(6), 2009Single IV dose given on Day 1 :

38. Unwanted ADC-mediated cytotoxicityTargeted binding to normal tissues expressing antigenOff-target (cross reactive) binding to normal tissues Non-antigen-mediated ADC uptake (e.g., Fc-mediated uptake, pinocytosis)Systemic release of toxin Instability of linkerCatabolism of ADCDAR+Modes of Toxicity of ADCsNormal Cell38

39. Early Observation: Highly Drugged ADCs More ToxicDAR 2DAR 4DAR 6DAR: Drug-to-Antibody RatioDAR 2DAR 4DAR 639

40. Engineered ThioMAb backbone allows more homogenous drug load (MMAE)Efficacy of TDC  ADC (mg/kg basis) and  2 x ADC (ug MMAE/m2 basis)ThioMAb Technology: Controlling HeterogeneityDARProportionDARProportionADCTDCJunutula, et al., Nat. Biotech., 26(8), 200840

41. Catabolism and Deconjugation of TDC is Slower than ADC in RatsJunutula, et al., Nat. Biotech., 26(8), 2008Catabolism of the AntibodyDeconjugation of the AntibodySingle dose I.V. PK study: ADC or TDC with matched cytotoxin (MMAE) doses

42. MMAE TDC is Better Tolerated Than ADC in MonkeysJunutula, et al., Nat. Biotech., 26(8), 2008No neutrophil decreases with TDC compared to equivalent ug/m2 dose of ADC42Repeat IV doses of ADC or TDC, Days 1 and 23:

43. Unwanted ADC-mediated cytotoxicityTargeted binding to normal tissues expressing antigenOff-target (cross reactive) binding to normal tissues Non-antigen-mediated ADC uptake (e.g., Fc-mediated uptake, pinocytosis)Systemic release of toxin Instability of linkerCatabolism of ADCDARSite of conjugation+Modes of Toxicity of ADCsNormal Cell43

44. Unwanted ADC-mediated cytotoxicityTargeted binding to normal tissues expressing antigenOff-target (cross reactive) binding to normal tissues Non-antigen-mediated ADC uptake (e.g., Fc-mediated uptake, pinocytosis)Systemic release of toxin Instability of linkerCatabolism of ADC+Modes of Toxicity of ADCsNormal Cell44

45. Unwanted ADC-mediated cytotoxicityTargeted binding to normal tissues expressing antigenOff-target (cross reactive) binding to normal tissues Non-antigen-mediated ADC uptake (e.g., Fc-mediated uptake, pinocytosis)Systemic release of toxin Instability of linkerCatabolism of ADC+Modes of Toxicity of ADCsNormal Cell45

46. SummaryAn ADC is both a “large molecule” and a “small molecule”.ADCs hold great promise for improving current oncology therapies.Highly potent cytotoxic agents are delivered directly to cancer cells, sparing normal tissues.ADCs tend to be better tolerated than standard chemotherapy. Increased therapeutic window allows for better balance between safety/efficacy.There is a fine balance between efficacy and toxicity.Choice of linker, cytotoxic drug and mAb are all important determinants of safety, PK, and efficacy.Toxicity is usually antigen-independent, ADC/drug-dependent.Linker stability, DAR, and site of drug conjugation impacts toxicity.46

47. Constructing a highly effective ADC for HER2-positive breast cancerT-SPDP-DM1T-SPP-DM1T-MCC-DM1T-SSNPP-DM3T-SSNPP-DM4Five trastuzumab–maytansinoid conjugates were constructed with various linkers to assess impact on drug activityXXXXLeast stableMost stableLinker and ADC advancesTrastuzumabmAbsMaytansineHER2DMR is:Maytansine: CH3DM1:CH2CH2SSMeDM3:CH2CH2CH(CH3)SSMeDM4: CH2CH2C(CH3)2SSMeEhrlich’s vision of targeted treatmentHormonal therapy and chemotherapies used to treat haematological & solid cancersDiscovery of antibodies1970s1980s1990s2000s1930–60s1900s1900sLewis Phillips GD, et al. Cancer Res 2008; 68: 9280–9290Key milestones in the development of Kadcyla

48. Another HER-2 Targeted Therapy in DevelopmentTrastuzumab-DM1 (T-DM1)TrastuzumabMertansine: anti-tubulin

49. 49T-DM1 binds to the HER2 protein on cancer cellsT-DM1 Selectively Delivers a Highly Toxic Payload to HER2-Positive Tumor CellsTrastuzumab-like activity by binding to HER2Targeted intracellular delivery of a potent antimicrotubule agent, DM1Potent antimicrotubule agent is released once inside the HER2-positive tumor cellReceptor-T-DM1 complex is internalized into HER2-positive cancer cell

50. ADC More Efficacious than Free Cytotoxin in MiceParsons et al, AACR (2007); Modified from S. SpencerT-DM1 (ADC)Free DM1 (cytotoxin)DM1

51. T-DM1 q3w – Phase I Trial: T-DM1 DOT51Krop IE, et al. JCO, 2010

52. ContraProDose/Efficacy3.6 mg/kg – q3w73% Clinical-Benefit44% Objective responsesDLT at 4.8 mg/kg: ThrombocytopeniaSignificant AEs at MTDThrombocytopeniaElevetad aminotrasferases FatigueNausea“T-DM1 was associated with mild, reversible toxicity, and substantial clinical activity in a heavily treated (HER2+) population”T-DM1 q3w Phase I TrialHeavily pre-treated HER2+ BC patientsKrop IE, et al. JCO, 2010

53. T-DM1 weekly – Phase I Study: T-DM1 DOT53Beeram M, et al. Cancer, 2012

54. ContraProDose/Efficacy2.4 mg/kg – every week57% Clinical-Benefit46% Objective responses18.6m median DOTSignificant G>=3 AEs Anemia (14%)Thrombocytopenia (11%)Pneumonia (11%)Increased AST (11%)“weekly dose of T-DM1 2.4 mg/kg has antitumor activity and is well tolerated in patients with HER2+ mBC ”T-DM1 weekly Phase I TrialHeavily pre-treated HER2+ BC patientsBeeram M, et al. Cancer, 2012

55. Burris HA, et al. J Clin Oncol, 2010Phase II Trial of Trastuzumab-DM1 for the Treatment of HER2+ mBC After Prior anti-HER2 therapy

56. Burris HA, et al. J Clin Oncol, 2010Phase II Trial of Trastuzumab-DM1 for the Treatment of HER2+ mBC After Prior anti-HER2 therapy

57. 571:1 HER2-positive, recurrent locally advanced BC or MBC (n=137)T-DM13.6 mg/kg Q3W until PDTrastuzumab 8 mg/kg dose; 6 mg/kg Q3W + Docetaxel 75 or 100 mg/m2 Q3WCrossoverT-DM1PDPerez EA, et al. ESMO 2010. Abstract LBA3. TDM1 Versus Trastuzumab + Docetaxel 1st line Randomized, phase II, international, open-label studyHER2-positive, measurable disease requiredStratification factorsWorld region, prior adjuvant trastuzumab therapy, disease-free interval Primary endpoints: PFS by INV, safetyKey secondary endpoints: ORR, clinical benefit, OS, QOL, symptom control

58. 58Perez EA, et al. Proc ESMO 2010. Abstract LBA3.† Most common AEs, any grade, T + D: alopecia: 66.2%, neutropenia: 57.4%, diarrhea: 45.6% — these were 1.5%, 7.5%, and 10.4% in pts receiving T-DM1. Most common AEs, any grade, T-DM1: nausea: 47.8%, fatigue: 46.3%, pyrexia: 35.8% — these were 39.7%, 46.2%, and 20.6% in pts receiving T + D.T-DM1(n=67)T + D(n=70)Efficacy Summary Overall response rate (ORR)47.8%41.4%Safety Summary Grade ≥3 adverse event (AE)†37.3%75.0%T-DM1 Versus Trastuzumab (T) + Docetaxel (D) in HER2-Positive MBC With No Prior Chemotherapy for MBC

59. 59T-DM1 Activity: Improved PFS59Hurvitz S, et al. ECCO-ESMO 2011. Abstract 5001.Treatment with T-DM1 reduced the probability of disease progression or death by 41% compared with Trastuzumab + DocetaxelHR=0.59, P=0.035Median Progression-Free Survival (months)trastuzumab + docetaxelT-DM1HER2+ locally advanced or metastatic01015514.29.2P=0.035

60.

61. 2000’s18972013FDA & EMAapprovalFrom Ehrlich’s vision to Kadcyla: Over 100 years in the makingEhrlich’s vision1–3Maytansine isolated4,5ADC & linker advances13Herceptin (trastuzumab) in trials and approval7,9–12HER2 oncoprotein7mAbs6Trastuzumab-MCC-DM1 selectedGreater activity compared with non-conjugated trastuzumabGood PK profileBest safety profileTaken into clinical studies1970sFive trastuzumab-DM1 conjugates with various linkers were evaluated13 2012Pivotal EMILIA* study reports successful survival and QoL benefits compared with lapatinib plus capecitabine and thus the final proof-of-concept of an ADC14 * EMILIA study population: Patients with HER2-positive locally advanced or metastatic breast cancer, who had received prior Herceptin and taxane therapy. Patients had either progressed within 6 months of completing adjuvant therapy or during metastatic treatment

62. And the rest of the story is about to come… EMILIATrastuzumab-emtamsineConcluding remarksHay be studied in combinationEffective, with high response rate even in heavily pretreated HER2+ BC patientsSafe, with most cytotoxic activity inside the HER2+ cellADC (Trastuzumab + anti microtubule

63. Updated Overall Survival Results From EMILIA, a Phase 3 Study of Trastuzumab Emtansine (T-DM1) vs Capecitabine and Lapatinib in HER2-Positive Locally Advanced or Metastatic Breast CancerS Verma,1 D Miles,2 L Gianni,3 IE Krop,4 M Welslau,5 J Baselga,6 M Pegram,7 D-Y Oh,8 V Diéras,9 E Guardino,10 L Fang,10 MW Lu,10 S Olsen,10 K Blackwell11 1Sunnybrook Odette Cancer Center, Toronto, Canada; 2Mount Vernon Cancer Center, Northwood, UK; 3San Raffaele Hospital, Milan, Italy; 4Dana-Farber Cancer Institute, Boston, MA, USA; 5Medical Office Hematology, Aschaffenburg, Germany; 6Massachusetts General Hospital, Boston, MA, USA; 7University of Miami Sylvester Comprehensive Cancer Center, Miami, FL, USA; 8Seoul National University College of Medicine, Seoul, Korea; 9Institut Curie, Paris, France; 10Genentech, Inc, South San Francisco, CA, USA; 11Duke Cancer Institute, Durham, NC, USA

64. Disclosure SlideVerma: Compensated consultant/advisory relationship with Roche/GSK; honoraria from GSK/Roche; research funding from Genentech/RocheMiles: Compensated consultant/advisory relationship with Genentech/Roche; honoraria from Genentech/RocheGianni: Compensated consultant/advisory relationship with Genentech/Roche, GSK, PfizerKrop: Uncompensated consultant/advisory relationship with Novartis; research funding from Genentech/RocheWelslau: NoneBaselga: Compensated consultant/advisory relationship with Genentech/RochePegram: Compensated consultant/advisory relationship with Genentech/Roche; honoraria from Genentech/RocheOh: NoneDieras: Compensated consultant/advisory relationship with Genentech/Roche, Novartis, Sanofi, Amgen, Clovis, Pfizer, GSK; honoraria from Genentech/Roche, Novartis, Sanofi, Amgen, Clovis, Pfizer, GSKGuardino: Genentech employee; owns Roche stockFang: Genentech employee; owns Roche stockLu: Genentech employee; owns Roche stockOlsen: Genentech employee; owns Roche and Sanofi stock Blackwell: None

65. PPPTrastuzumab Emtansine (T-DM1): Mechanism of ActionHER2Adapted from LoRusso PM, et al. Clin Cancer Res 2011.NucleusAntibody: TrastuzumabEmtansineCytotoxic: DM1Stable linker: MCC

66. Trastuzumab Emtansine (T-DM1): Mechanism of ActionHER2Adapted from LoRusso PM, et al. Clin Cancer Res 2011.NucleusTrastuzumab-specific MOAAntibody-dependent cellular cytotoxicity (ADCC)Inhibition of HER2 signalingInhibition of HER2 sheddingPPP

67. Trastuzumab Emtansine (T-DM1): Mechanism of ActionEmtansine releaseInhibition of microtubule polymerizationInternalizationHER2Adapted from LoRusso PM, et al. Clin Cancer Res 2011.T-DM1LysosomeNucleusPPPTrastuzumab-specific MOAAntibody-dependent cellular cytotoxicity (ADCC)Inhibition of HER2 signalingInhibition of HER2 shedding

68. EMILIA Study DesignStratification factors: World region, number of prior chemo regimens for MBC or unresectable LABC, presence of visceral diseasePrimary endpoints: PFS by independent review, OS, and safetyKey secondary endpoints: PFS by investigator, ORR, DORStatistical considerations: Hierarchical statistical analysis was performed in pre-specified sequential order: PFS by independent review → OS → secondary endpointsPFS analysis: 90% power to detect HR=0.75; 2-sided alpha 5%OS analyses: 80% power to detect HR=0.80; 2-sided alpha 5%1:1 HER2-positive LABC or MBC (N=980)Prior taxane and trastuzumab Progression on metastatic treatment or within 6 months of adjuvant treatmentPDT-DM1 3.6 mg/kg q3w IVCapecitabine 1000 mg/m2 PO bid, days 1–14, q3w+ Lapatinib 1250 mg/day PO qdPD

69. Following health authority interactions 50% of targeted number of OS events (n=316)Actual number of OS events: 331 eventsFinal PFS analysis: Targeted number: 508 eventsActual number: 569 events1st Interim OS analysis: Preplanned at time of final PFS analysisDid not cross efficacy stopping boundarySafety and Secondary Endpoint analysis2nd Interim OS Analysis Data cut-off July 31, 2012Final PFS and 1st Interim OS AnalysisData cut-off Jan 14, 2012Presented at ASCO 2012EMILIA AnalysesFinal OS AnalysisExpected 2014Targeted number of events: 632

70. Patient Demographics and Baseline Characteristics (1)Cap + Lap(n=496)T-DM1(n=495)Median age, years (range)53 (24–83)53 (25–84)Race, n (%)WhiteAsianBlack/African AmericanOtherNot available 374 (75) 86 (17) 21 (4) 10 (2) 5 (1) 358 (72) 94 (19) 29 (6) 7 (1) 7 (1)World region, n (%)United StatesWestern EuropeAsiaOther 136 (27) 160 (32) 76 (15) 124 (25) 134 (27) 157 (32) 82 (17) 122 (25)ECOG PS, n (%)01 312 (64) 176 (36) 299 (61) 194 (39)

71. Cap + Lap(n=496)T-DM1(n=495)Measurable disease by independent review, n (%)389 (78)397 (80)Site of disease involvement, n (%)VisceralNon-visceral335 (68)161 (32)334 (67)161 (33)Metastatic sites, n (%)<3≥3Unknown307 (62)175 (35)14 (3)298 (60)189 (38) 8 (2)ER/PR status, n (%)ER+ and/or PR+ER− and PR−Unknown263 (53)224 (45) 9 (2)282 (57)202 (41)11 (2)Patient Demographics and Baseline Characteristics (2)

72. Prior Systemic TreatmentCap + Lap(n=496)T-DM1 (n=495)Prior treatment type, n (%)TaxanesAnthracyclinesEndocrine agents 494 (100)302 (61)204 (41) 493 (100)303 (61)205 (41) Prior therapy for MBC, n (%)YesNo 438 (88) 58 (12)435 (88) 60 (12)Prior trastuzumab treatment, n (%) Early breast cancer only 495 (100) 77 (16) 495 (100) 78 (16)Duration of trastuzumab treatment, n (%)<1 year≥1 year212 (43)284 (57)210 (42)285 (58)Median time since last trastuzumab, months (range)1.5 (0–98)1.5 (0–63)

73. Patient DispositionPrimary analysis data cut-offJan 14, 2012Updated OS data cut-offJuly 31, 2012Cap + LapT-DM1Cap + LapT-DM1Randomized, n496495496495Treated, n488490488490Median follow-up, months12.412.918.619.1On study at data cut-off date, n316366262308On treatment, n12518255106Deaths, n12994182149

74. Drug ExposureCap (n=487)Lap (n=488)T-DM1 (n=490)Median dose intensity, %77.293.499.9Pts with dose reduction, n (%)260 (53.4)133 (27.3) 80 (16.3)T-DM1 decreased to 3.0 mg/kg, n (%)—— 58 (11.8)T-DM1 decreased to 2.4 mg/kg, n (%)——22 (4.5)

75. Progression-Free Survival by Independent Review496404310176129735335251498510049541934123618313010172544430189310Cap + LapT-DM1No. at risk by independent review:Median (months)No. of eventsCap + Lap6.4304T-DM19.6265Stratified HR=0.650 (95% CI, 0.55, 0.77) P<0.00010.00.20.40.60.81.0024681012141618202224262830Proportion progression-freeTime (months)Unstratified HR=0.66 (P<0.0001).

76. Progression-Free Survival Subgroup AnalysesPre-specified Stratification FactorsMedian,mosT-DM1HR(95% CI)Median,mosCap + LapTotalnBaseline characteristicT-DM1betterCap + LapbetterHazard ratio0.20.51259.60.66 (0.56, 0.78)6.4991All patients8.510.99.60.70 (0.51, 0.98)0.56 (0.41, 0.74)0.73 (0.56, 0.94)5.76.46.9270317404World regionUSWestern EuropeOther10.38.50.68 (0.55, 0.85)0.63 (0.49, 0.82)6.75.7609382Number prior chemo regimens for MBC or unresectable LABC0–1>19.68.50.55 (0.45, 0.67)0.96 (0.71, 1.30)5.710.2669322Disease involvementVisceralNonvisceral

77. Overall Survival: First Interim Analysis49646943836429624219515512997745231177321049548446139033127722018214912396674629165200Cap + LapT-DM1No. at risk:Time (months)Proportion surviving0.00.20.40.60.81.002468101214161820222426283032343677.0%65.4%47.5%84.7%Median (months)No. of eventsCap + Lap23.3129T-DM1NR 94Stratified HR=0.621 (95% CI, 0.48, 0.81); P=0.0005 Efficacy stopping boundary P=0.0003 or HR=0.617Unstratified HR=0.63 (P=0.0005). NR, not reached.

78. Overall Survival: Confirmatory Analysis49647145343540336829724020415913311086634527177449548547445743941834929324219716413611186623828135Cap + LapT-DM1No. at risk:Time (months)78.4%64.7%51.8%85.2%0246810121416182022242628303234360.00.20.40.60.81.0Proportion survivingData cut-off July 31, 2012; Unstratified HR=0.70 (P=0.0012). Median (months)No. of eventsCap + Lap25.1182T-DM130.9 149Stratified HR=0.682 (95% CI, 0.55, 0.85); P=0.0006 Efficacy stopping boundary P=0.0037 or HR=0.727

79. Cap + LapT-DM1Baseline characteristicTotalnMedian (mos)Median (mos)HR(95% CI)T-DM1BetterCap + LapBetterAll patients99125.130.90.70 (0.56, 0.87)World regionUnited States27023.7NR0.62 (0.41, 0.96)Western Europe31728.627.80.95 (0.65, 1.39)Asia15822.734.30.48 (0.27, 0.85)Other24622.726.10.68 (0.45, 1.04)Number of prior chemotherapeutic regimens for LABC or MBC 0–160928.029.80.80 (0.61, 1.07)>138222.731.90.58 (0.41, 0.81)Disease involvementVisceral66921.928.40.59 (0.46, 0.76)Nonvisceral322NR33.91.05 (0.69, 1.61)Overall Survival Subgroup AnalysesFrom confirmatory OS analysis; data cut-off July 31, 2012.Hazard ratio0.20.5125NR, not reached.

80. Cap + LapT-DM1Baseline characteristicTotalnMedian (mos)Median (mos)HR(95% CI)T-DM1BetterCap + LapBetterAll patients99125.130.90.70 (0.56, 0.87)Age group<65 years85324.630.90.66 (0.52, 0.83)65–74 years11327.1NR0.74 (0.37, 1.47)≥75 years25NR11.13.45 (0.94, 12.65)ER and PR statusER+ and/or PR+ 54525.331.90.62 (0.46, 0.85)ER– and PR–42623.727.10.75 (0.54, 1.03)Line of therapyaFirst-line11827.9NR0.61 (0.32, 1.16)Second-line361NR27.10.88 (0.61, 1.27)Third- and later-line51223.333.90.62 (0.46, 0.84)Overall Survival Subgroup AnalysesHazard ratio0.20.5125aDefined as any systemic therapy including endocrine and chemotherapy.NR, not reached.From confirmatory OS analysis; data cut-off July 31, 2012.

81. ORR and DOR in Patients with Measurable DiseaseObjective response rate (ORR)Duration of response (DOR)0.00.20.40.60.81.0Proportion progression-free0 2 4 6 8 10 12 14 16 18 20 22 24 26 28 30 32 34 36Median, months (95% CI)Cap + Lap6.5 (5.5, 7.2)T-DM112.6 (8.4, 20.8)Difference: 12.7% (95% CI, 6.0, 19.4)P=0.0002120105774832149833110000173159126846547423327191282000Cap + LapT-DM1No. at risk000000Time (months)Patients, %02030405010 T-DM1 173/397 120/38943.6%30.8%Cap + Lap

82. Overview of Adverse EventsaCap + Lap: coronary artery disease, multi-organ failure, coma, and hydrocephalus; T-DM1: metabolic aencephalopathy.Cap + Lap (n=488)T-DM1 (n=490)All-grade AE, n (%)477 (97.7)470 (95.9)Grade ≥3 AE, n (%)278 (57.0)200 (40.8)AEs leading to treatment discontinuation (for any study drug), n (%) 52 (10.7)29 (5.9)AEs leading to death within 30 days of last dose of study drug, n (%)a 4 (0.8) 1 (0.2)

83. Adverse EventsGrade ≥3 AEs With Incidence ≥2%Cap + Lap(n=488)T-DM1(n=490)Adverse EventAll Grades, %Grade ≥3, %All Grades, %Grade ≥3, %Diarrhea79.720.723.31.6Hand-foot syndrome58.016.41.20.0Vomiting29.34.519.00.8Neutropenia8.64.35.92.0Hypokalemia8.64.18.62.2Fatigue27.93.535.12.4Nausea44.72.539.20.8Mucosal inflammation19.12.36.70.2Thrombocytopenia2.50.228.012.9Increased AST9.40.822.44.3Increased ALT 8.81.416.92.9Anemia8.01.610.42.7ALT, alanine aminotransferase; AST, aspartate aminotransferase.

84. Cardiac DysfunctionCap + Lap T-DM1 Cardiac dysfunction AEs,a n (%)All gradesGrade 3(n=488)15 (3.1)2 (0.4)(n=490)9 (1.8)1 (0.2)Lowest post-baseline LVEF value, n (%)≥45%≥40 to <45%<40%(n=461)454 (98.5)4 (0.9)3 (0.7)(n=482)476 (98.8)3 (0.6)3 (0.6)LVEF <50% and ≥15-point decrease from baseline, n (%)(n=445)7 (1.6)(n=481)8 (1.7)aIncludes preferred terms ‘decreased ejection fraction’ and ‘left ventricular dysfunction’; Does not include cardiac AEs (e.g. myocardial infarction, atrial fibrillation).

85. ConclusionsIn the EMILIA study, T-DM1 achieved:Significant improvement in PFSMedian PFS: Cap + Lap 6.4 mos; T-DM1 9.6 mosHR=0.650; P<0.0001Significant improvement in OS Median OS: Cap + Lap 25.1 mos; T-DM1 30.9 mosHR=0.682; P=0.0006Key secondary efficacy endpoints including time to symptom progression1 were also significantly improved with T-DM1The safety profile of T-DM1 was favorable to that of Cap + LapT-DM1 should offer an important therapeutic option in the treatment of HER2-positive metastatic breast cancer1Welslau et al. ESMO 2012, Poster 329P.

86. ThanksTo the scientistsTo the investigators, clinicians and research staff at the 213 sites in 26 countriesTo all of the patients who participated in the trial and their families

87. Krop I, et al. EMILIA investigators, SABCS 2013

88. Krop I, et al. EMILIA investigators, SABCS 2013

89. Krop I, et al. EMILIA investigators, SABCS 2013

90. EMILIA Biomarker Analysis: PFS by HER2 mRNA Level and Treatment ArmBaselga J, et al. EMILIA Investigators

91. EMILIA Biomarker Analysis: PFS by EGFR, HER3 and PTEN ExpressionBaselga J, et al. EMILIA Investigators

92. Cytotoxic Activity of T-DM1 in HER2-Positive Breast Cancer Cell Lines With PIK3CA MutationsBaselga J, et al. EMILIA Investigators

93. EMILIA Biomarker Analysis: PFS by PIK3CA Mutation Status Level and Treatment ArmBaselga J, et al. EMILIA Investigators

94. EMILIA Biomarker Analysis: PFS by PIK3CA Mutation Status Level and Treatment ArmBaselga J, et al. EMILIA Investigators

95. EMILIA Biomarker Analysis: PFS by PIK3CA Mutation Status Level and Treatment ArmBaselga J, et al. EMILIA Investigators

96. EMILIA Biomarker AnalysisBaselga J, et al. EMILIA Investigators

97. EMILIA Biomarker AnalysisBaselga J, et al. EMILIA Investigators

98. T-DM1 for HER2-Positive MBC: Primary Results From TH3RESA, a Phase 3 Study of T-DM1 vs Treatment of Physician’s ChoiceH Wildiers,1 S-B Kim,2 A Gonzalez-Martin,3 PM LoRusso,4 J-M Ferrero,5 M Smitt,6 R Yu,6 A Leung,6 IE Krop71University Hospitals Leuven, Leuven, Belgium; 2Asan Medical Center, University of Ulsan College of Medicine, Seoul, Korea; 3Centro Oncológico MD Anderson International España, Madrid, Spain; 4Karmanos Cancer Institute, Wayne State University, Detroit, MI, USA; 5Department of Medical Oncology, Centre Antoine Lacassagne, Nice, France; 6Genentech, Inc, South San Francisco, CA, USA; 7Dana-Farber Cancer Institute, Harvard Medical School, Boston, MA, USA2013

99. Disclosure SlideWildiers: advisory board for RocheKim: advisory board for Novartis, research grant from Novartis and IldongGonzalez-Martin: advisory board for RocheLoRusso: advisory board for Genentech, research grant from Genentech, speakers bureau for GenentechFerrero: research grant from Roche and Novartis Smitt, Yu, Leung: Genentech employee, Roche stockKrop: research grant from Genentech

100. Trastuzumab Emtansine (T-DM1): Mechanism of ActionAdapted from LoRusso PM, et al. Clin Cancer Res 2011.Emtansine releaseInhibition of microtubule polymerizationInternalizationHER2LysosomeNucleusPPPAntibody: TrastuzumabEmtansineCytotoxic: DM1Stable linker: MCCAntibody–drugconjugate:T-DM1

101. T-DM1: BackgroundPhase 3 EMILIA study in patients with HER2-positive LABC and MBC previously treated with a taxane and trastuzumab1: Median PFS and OS were longer in the T-DM1 arm vs the capecitabine + lapatinib armPFS: HR=0.65 (95% CI, 0.55, 0.77); P<0.001OS: HR=0.68 (95% CI, 0.55, 0.85); P<0.001Fewer grade ≥3 AEs were reported with T-DM1 vs capecitabine + lapatinib (41% vs 57%)Approved in several countries worldwideT-DM1 has not previously been studied in a randomized trial in patients who received prior treatment with both trastuzumab and lapatinib for advanced disease1 Verma S, et al. N Engl J Med 2012.AE, adverse events; CI, confidence interval; HER2, human epidermal growth factor receptor 2; HR, hazard ratio; LABC, unresectable locally advanced breast cancer; MBC, metastatic breast cancer; PFS, progression-free survival; OS, overall survival.

102. 2T-DM1c(optional crossover)TH3RESA Study SchemaStratification factors: World region, number of prior regimens for advanced BC,d presence of visceral diseaseCo-primary endpoints: PFS by investigator and OSKey secondary endpoints: ORR by investigator and safetyPDPDT-DM1 3.6 mg/kg q3w IV(n=400)Treatment of physician’s choice (TPC)b(n=200)HER2-positive (central) advanced BCa(N=600)≥2 prior HER2-directed therapies for advanced BCPrior treatment with trastuzumab, lapatinib, and a taxanea Advanced BC includes MBC and unresectable locally advanced/recurrent BC.b TPC could have been single-agent chemotherapy, hormonal therapy, or HER2-directed therapy, or a combination of a HER2-directed therapy with a chemotherapy, hormonal therapy, or other HER2-directed therapy.c First patient in: Sep 2011. Study amended Sep 2012 (following EMILIA 2nd interim OS results) to allow patients in the TPC arm to receive T-DM1 after documented PD.d Excluding single-agent hormonal therapy.BC, breast cancer; IV, intravenous; ORR, objective response rate; PD, progressive disease; q3w, every 3 weeks.1

103. Statistical ConsiderationsFinal PFS analysisa (by investigator assessment)Targeted number of events: 32480% power to detect HR=0.65; 2-sided alpha 0.5%1st interim OS analysisa (prespecified to occur with final PFS analysis)Number of observed events: 105Efficacy crossing boundary HR<0.363; P<0.0000013 Final OS analysisTargeted number of events: 49280% power to detect HR=0.76; 2-sided alpha 4.5%a Clinical data cutoff: February 11, 2013.

104. Baseline Characteristics (1)CharacteristicTPC(n=198)T-DM1(n=404)Age, %<65 years65–74 years≥75 years 82.8 14.1 3.0 85.4 11.4 3.2World region, %United StatesWestern EuropeOther 24.2 42.9 32.8 24.5 42.3 33.2Race, %WhiteAsianOthera 81.3 12.1 6.6 80.4 14.1 5.4ECOG PS,b %012 41.4 51.0 7.6 44.8 49.8 5.5a Multi-racial patients are included in the Other category.b Two patients in the T-DM1 arm had missing ECOG PS scores: TPC, n=198; T-DM1, n=402.ECOG PS, Eastern Cooperative Oncology Group performance status.

105. CharacteristicTPC(n=198)T-DM1(n=404)ER and/or PR-positive, % 52.0 51.5Visceral involvement, % 75.8 74.8Disease extent at study entry, %Metastatic Unresectable locally advanced/recurrent BC 94.4 5.6 96.8 3.2Number of prior regimens for advanced BC,a median (range)≤3, %4–5, %>5, % 4 (1–19) 39.4 32.8 27.8 4 (1–14) 32.6 37.1 30.3Brain metastasis at baseline, % 13.6 9.9Baseline Characteristics (2)a Two patients in the T-DM1 arm had missing information for prior treatment in the advanced BC setting: TPC, n=198; T-DM1, n=402. ER, estrogen receptor; PR, progesterone receptor.

106. TPC Treatment CategoryTPC treatment categoryTPC(n=184a)Combination with HER2-directed agent, %Chemotherapyb + trastuzumabLapatinib + trastuzumabHormonal therapy + trastuzumabChemotherapyb + lapatinib 83.2 68.5 10.3 1.6 2.7Single-agent chemotherapy,b % 16.8a Includes patients who received study treatment. b The most common chemotherapy agents used were vinorelbine, gemcitabine, eribulin, paclitaxel, and docetaxel.T-containing 80.4

107. Study discontinuationTPC(n=198)T-DM1(n=404)Discontinued study, % 36.9 21.0Reasons for study discontinuation, %DeathWithdrawal by patientPhysician’s decisionOther 22.2 13.1 1.0 0.5 15.1 4.7 0.5 0.7Study Discontinuation

108. PFS by Investigator AssessmentMedian follow-up: TPC, 6.5 months; T-DM1, 7.2 months.Unstratified HR=0.521 (P<0.0001).1981206228136104043342411146627120TPCT-DM1No. at risk:Time (months)14121086420.00.20.40.60.81.00Proportion progression-freeTPC (n=198)T-DM1 (n=404)Median (months)3.36.2No. of events129219Stratified HR=0.528 (95% CI, 0.422, 0.661)P<0.0001

109. PFS Subgroup Analyses (1)TPCT-DM1T-DM1BetterTPCBetterBaseline characteristicTotalnnEventMedian(months)nEventMedian(months)HRaAll patients6021981293.34042196.20.52(0.42, 0.65)World regionUnited StatesWestern EuropeOther1472561994885652461444.13.23.1991711345891705.86.95.80.710.440.53(0.44, 1.14)(0.32, 0.61)(0.36, 0.78)0.20.5125Age group<65 years65–74 years≥75 years50974191642861081743.43.23.034546131912535.86.9NE0.550.420.14(0.44, 0.70)(0.22, 0.80)(0.02, 0.79)a Unstratified HR.NE, not estimable.By Investigator AssessmentBaseline ECOG PS0122623013782101154868133.63.11.61802002284120137.05.46.90.440.630.41(0.31, 0.64)(0.47, 0.85)(0.19, 0.92)RaceWhiteAsianOther488813516124131041783.42.83.3325572217730126.35.46.60.500.630.57(0.39, 0.64)(0.35, 1.14)(0.23, 1.41)(95% CI)

110. Disease involvementVisceralNonvisceral4521501504895343.43.1302102168516.26.70.560.41(0.44, 0.72)(0.26, 0.64)≤34–5Number of prior regimensfor advanced BC>52092141777865554945353.33.72.91311491226083756.96.25.80.480.580.48(0.32, 0.70)(0.40, 0.83)(0.32, 0.73)PFS Subgroup Analyses (2)TPCER and PR statusER+ and/or PR+ER– and PR–Unknown311270211038510665853.92.93.92081851110910555.96.08.30.560.510.17(0.41, 0.76)(0.37, 0.71)(0.03, 0.93)T-DM1BetterTPCBetterBaseline characteristicTotalnnEventMedian(months)nEventMedian(months)All patients6021981293.34042196.20.52(0.42, 0.65)a Unstratified HR.By Investigator AssessmentBrain metastasis at baselineYesNo6753527171161132.93.640364241955.86.20.470.53(0.24, 0.89)(0.42, 0.66)T-DM10.20.5125HRa(95% CI)

111. PFS for Patients Treated With Trastuzumab-Containing Regimens149995020125104043342411146627120TPCT-DM1No. at risk:Time (months)14121086420.00.20.40.60.81.0Proportion progression-free0Unstratified HR=0.54 (P<0.0001).TPC (T-containing) (n=149)T-DM1 (n=404)Median (months)3.26.2No. of events101219Stratified HR=0.558 (95% CI, 0.437, 0.711)P<0.0001

112. First Interim OS Analysis1984041693811253168020751127306593000TPCT-DM1No. at risk:37Time (months)44 patients in the TPC arm received crossover T-DM1 treatment after documented progression.Unstratified HR=0.57 (P=0.004).16121086420.00.20.40.60.81.0Proportion surviving014Observed 21% of targeted eventsTPC(n=198)T-DM1(n=404)Median (months)14.9NENo. of events4461Stratified HR=0.552 (95% CI, 0.369, 0.826); P=0.0034Efficacy stopping boundary HR<0.363 or P<0.0000013

113. ORR in Patients With Measurable DiseaseDifference: 22.7% (95% CI, 16.2, 29.2)P<0.0001Patients, % T-DM1TPC31.3%8.6%108/34514/163By Investigator Assessment

114. Overview of AEsTPC (n=184a)T-DM1(n=403a)All-grade AEs, % 88.6 93.5Grade ≥3 AEs,b % 43.5 32.3AEs leading to treatment discontinuation,c % 10.9 6.7AEs leading to dose reduction, % 19.6 9.4LVEF <50% and ≥15% decrease from baseline,d % 1.1 1.5a One patient randomized to the TPC arm received 2 cycles of T-DM1 by mistake; this patient was included in the T-DM1 group for safety analyses.b Grade 5 AEs: TPC, 1.6% (n=3); T-DM1, 1.2% (n=5). Three were considered related to T-DM1: hepatic encephalopathy, subarachnoid hemorrhage, and pneumonitis. One was considered related to TPC: noncardiogenic pulmonary edema.c For any study drug.d No patient experienced an LVEF <40%.LVEF, left ventricular ejection fraction.

115. Grade ≥3 AEs With Incidence ≥2% in Either Armaa Medical Dictionary for Regulatory Activities (MedDRA) preferred term.b Grade 5 subarachnoid hemorrhage was reported for 1 patient with grade 4 thrombocytopenia; grade 4 tumor hemorrhage was reported for 1 patient with grade 3 thrombocytopenia. The incidence of grade ≥3 hemorrhage of any type was 2.2% (T-DM1) and 0.5% (TPC). AST, aspartate aminotransferase.Highlighting indicates grade ≥3 AEs with >3% difference between the TPC and T-DM1 arms.TPC (n=184)T-DM1 (n=403)Any gradeGrade ≥3Any gradeGrade ≥3Nonhematologic AEs, %Diarrhea 21.7 4.3 9.9 0.7Abdominal pain 12.5 2.7 6.5 1.2AST increased 5.4 2.2 8.4 2.2Fatigue 25.0 2.2 27.0 2.0Asthenia 15.8 2.2 15.6 1.0Cellulitis 3.3 2.2 1.2 0.5Pulmonary embolism 2.2 2.2 0.5 0.5Dyspnea 9.2 1.6 9.9 2.0Hematologic AEs, %Neutropenia 21.7 15.8 5.5 2.5Febrile neutropenia 3.8 3.8 0.2 0.2Anemia 10.3 2.7 8.9 2.7Leukopenia 6.0 2.7 0.7 0.2Thrombocytopenia 3.3 1.6 15.1 4.7b

116. ConclusionsT-DM1 demonstrated improved efficacy and safety compared with TPCSignificant improvement in PFSHR=0.528; P<0.0001A clear and consistent treatment effect across subgroupsInterim OS favored T-DM1 but efficacy stopping boundary not crossedHR=0.552; P=0.0034Safety and ORR favored T-DM1Fewer grade ≥3 AEs with T-DM1 vs TPC: 32.3% vs 43.5%Fewer discontinuations and dose reductions due to AEs with T-DM1ORR 31.3% vs 8.6%, P<0.0001These data reaffirm the results from the EMILIA study, demonstrating a consistent benefit with T-DM1 in patients with previously treated HER2-positive advanced BC

117. ThanksTo all of the patients who participated in the trial and their families, as well as the participating study sites