/
Evaluation of Marine Invertebrate Biodiversity in the East River Evaluation of Marine Invertebrate Biodiversity in the East River

Evaluation of Marine Invertebrate Biodiversity in the East River - PowerPoint Presentation

della
della . @della
Follow
0 views
Uploaded On 2024-03-13

Evaluation of Marine Invertebrate Biodiversity in the East River - PPT Presentation

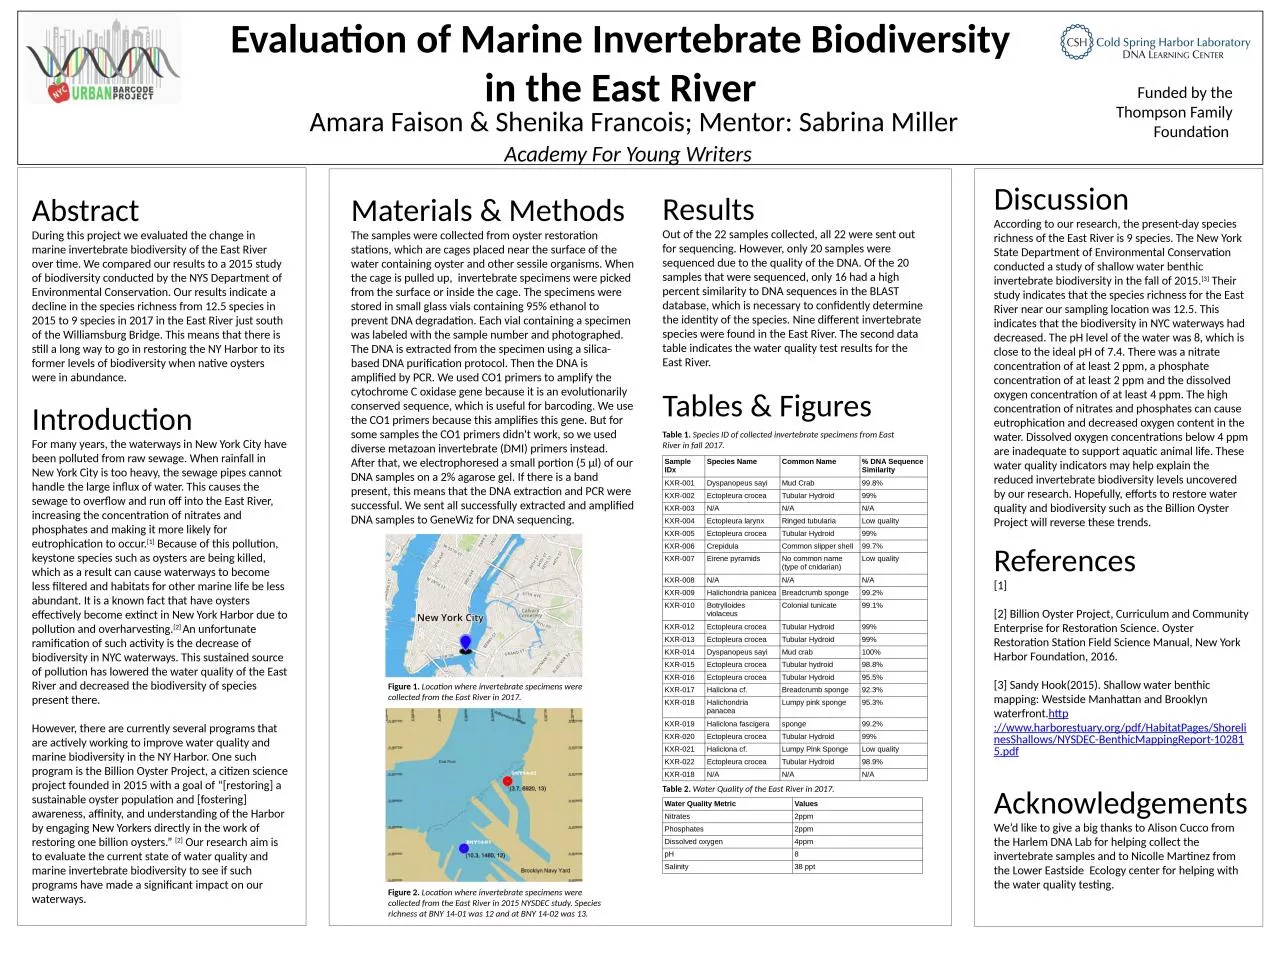
A cademy For Young Writers Amara Faison amp Shenika Francois Mentor Sabrina Miller Abstract During this project we evaluated the change in marine invertebrate biodiversity of the East River over time We compared our results to a 2015 study of biodiversity conducted by the NYS Depa ID: 1047229

water kxr river east kxr water east river invertebrate biodiversity dna species quality croceatubular samples oyster 2015 harbor york

Share:

Link:

Embed:

Download Presentation from below link

Download Presentation The PPT/PDF document "Evaluation of Marine Invertebrate Biodiv..." is the property of its rightful owner. Permission is granted to download and print the materials on this web site for personal, non-commercial use only, and to display it on your personal computer provided you do not modify the materials and that you retain all copyright notices contained in the materials. By downloading content from our website, you accept the terms of this agreement.


Presentation Transcript

1. Evaluation of Marine Invertebrate Biodiversity in the East RiverAcademy For Young WritersAmara Faison & Shenika Francois; Mentor: Sabrina Miller AbstractDuring this project we evaluated the change in marine invertebrate biodiversity of the East River over time. We compared our results to a 2015 study of biodiversity conducted by the NYS Department of Environmental Conservation. Our results indicate a decline in the species richness from 12.5 species in 2015 to 9 species in 2017 in the East River just south of the Williamsburg Bridge. This means that there is still a long way to go in restoring the NY Harbor to its former levels of biodiversity when native oysters were in abundance.IntroductionFor many years, the waterways in New York City have been polluted from raw sewage. When rainfall in New York City is too heavy, the sewage pipes cannot handle the large influx of water. This causes the sewage to overflow and run off into the East River, increasing the concentration of nitrates and phosphates and making it more likely for eutrophication to occur.[1] Because of this pollution, keystone species such as oysters are being killed, which as a result can cause waterways to become less filtered and habitats for other marine life be less abundant. It is a known fact that have oysters effectively become extinct in New York Harbor due to pollution and overharvesting.[2] An unfortunate ramification of such activity is the decrease of biodiversity in NYC waterways. This sustained source of pollution has lowered the water quality of the East River and decreased the biodiversity of species present there. However, there are currently several programs that are actively working to improve water quality and marine biodiversity in the NY Harbor. One such program is the Billion Oyster Project, a citizen science project founded in 2015 with a goal of “[restoring] a sustainable oyster population and [fostering] awareness, affinity, and understanding of the Harbor by engaging New Yorkers directly in the work of restoring one billion oysters.” [2] Our research aim is to evaluate the current state of water quality and marine invertebrate biodiversity to see if such programs have made a significant impact on our waterways. Materials & Methods The samples were collected from oyster restoration stations, which are cages placed near the surface of the water containing oyster and other sessile organisms. When the cage is pulled up,  invertebrate specimens were picked from the surface or inside the cage. The specimens were stored in small glass vials containing 95% ethanol to prevent DNA degradation. Each vial containing a specimen was labeled with the sample number and photographed. The DNA is extracted from the specimen using a silica-based DNA purification protocol. Then the DNA is amplified by PCR. We used CO1 primers to amplify the cytochrome C oxidase gene because it is an evolutionarily conserved sequence, which is useful for barcoding. We use the CO1 primers because this amplifies this gene. But for some samples the CO1 primers didn't work, so we used diverse metazoan invertebrate (DMI) primers instead. After that, we electrophoresed a small portion (5 μl) of our DNA samples on a 2% agarose gel. If there is a band present, this means that the DNA extraction and PCR were successful. We sent all successfully extracted and amplified DNA samples to GeneWiz for DNA sequencing. ResultsOut of the 22 samples collected, all 22 were sent out for sequencing. However, only 20 samples were sequenced due to the quality of the DNA. Of the 20 samples that were sequenced, only 16 had a high percent similarity to DNA sequences in the BLAST database, which is necessary to confidently determine the identity of the species. Nine different invertebrate species were found in the East River. The second data table indicates the water quality test results for the East River.Tables & FiguresDiscussion According to our research, the present-day species richness of the East River is 9 species. The New York State Department of Environmental Conservation conducted a study of shallow water benthic invertebrate biodiversity in the fall of 2015.[3] Their study indicates that the species richness for the East River near our sampling location was 12.5. This indicates that the biodiversity in NYC waterways had decreased. The pH level of the water was 8, which is close to the ideal pH of 7.4. There was a nitrate concentration of at least 2 ppm, a phosphate concentration of at least 2 ppm and the dissolved oxygen concentration of at least 4 ppm. The high concentration of nitrates and phosphates can cause eutrophication and decreased oxygen content in the water. Dissolved oxygen concentrations below 4 ppm are inadequate to support aquatic animal life. These water quality indicators may help explain the reduced invertebrate biodiversity levels uncovered by our research. Hopefully, efforts to restore water quality and biodiversity such as the Billion Oyster Project will reverse these trends. References[1] [2] Billion Oyster Project, Curriculum and Community Enterprise for Restoration Science. Oyster Restoration Station Field Science Manual, New York Harbor Foundation, 2016.   [3] Sandy Hook(2015). Shallow water benthic mapping: Westside Manhattan and Brooklyn waterfront.http://www.harborestuary.org/pdf/HabitatPages/ShorelinesShallows/NYSDEC-BenthicMappingReport-102815.pdfAcknowledgementsWe’d like to give a big thanks to Alison Cucco from the Harlem DNA Lab for helping collect the invertebrate samples and to Nicolle Martinez from the Lower Eastside Ecology center for helping with the water quality testing.Funded by theThompson Family Foundation Sample IDxSpecies NameCommon Name% DNA Sequence SimilarityKXR-001Dyspanopeus sayiMud Crab99.8%KXR-002Ectopleura croceaTubular Hydroid99%KXR-003N/AN/AN/AKXR-004Ectopleura larynxRinged tubulariaLow qualityKXR-005Ectopleura croceaTubular Hydroid99%KXR-006CrepidulaCommon slipper shell99.7%KXR-007Eirene pyramidsNo common name (type of cnidarian)Low qualityKXR-008N/AN/AN/AKXR-009Halichondria paniceaBreadcrumb sponge99.2%KXR-010Botrylloides violaceusColonial tunicate99.1%KXR-012Ectopleura croceaTubular Hydroid99%KXR-013Ectopleura croceaTubular Hydroid99%KXR-014Dyspanopeus sayiMud crab100%KXR-015Ectopleura croceaTubular hydroid98.8%KXR-016Ectopleura croceaTubular Hydroid95.5%KXR-017Haliclona cf.Breadcrumb sponge92.3%KXR-018Halichondria panaceaLumpy pink sponge95.3%KXR-019Haliclona fascigerasponge99.2%KXR-020Ectopleura croceaTubular Hydroid99%KXR-021Haliclona cf.Lumpy Pink SpongeLow qualityKXR-022Ectopleura croceaTubular Hydroid98.9%KXR-018N/AN/AN/AWater Quality MetricValuesNitrates2ppmPhosphates2ppmDissolved oxygen 4ppmpH8Salinity38 pptFigure 1. Location where invertebrate specimens were collected from the East River in 2017. Table 1. Species ID of collected invertebrate specimens from East River in fall 2017. Table 2. Water Quality of the East River in 2017. Figure 2. Location where invertebrate specimens were collected from the East River in 2015 NYSDEC study. Species richness at BNY 14-01 was 12 and at BNY 14-02 was 13.