/
Automated Identification of Abnormal Adult EEGs Automated Identification of Abnormal Adult EEGs

Automated Identification of Abnormal Adult EEGs - PowerPoint Presentation

discoverfe
discoverfe . @discoverfe
Follow
343 views
Uploaded On 2020-10-22

Automated Identification of Abnormal Adult EEGs - PPT Presentation

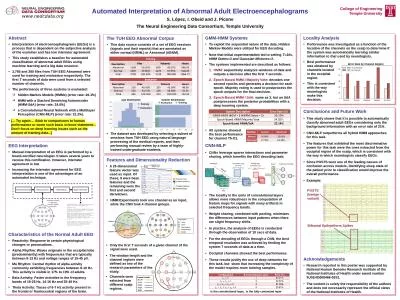
A Thesis Proposal by Silvia López de Diego Neural Engineering Data Consortium College of Engineering Temple University Philadelphia Pennsylvania USA Abstract The interpretation of electroencephalograms EEGs is a process that is still dependent on the subjective analysis of the examine ID: 814610

abnormal eeg hmm normal eeg abnormal normal hmm system eegs classification learning data analysis gmm error deep interpretation http

Share:

Link:

Embed:

Download Presentation from below link

Download The PPT/PDF document "Automated Identification of Abnormal Adu..." is the property of its rightful owner. Permission is granted to download and print the materials on this web site for personal, non-commercial use only, and to display it on your personal computer provided you do not modify the materials and that you retain all copyright notices contained in the materials. By downloading content from our website, you accept the terms of this agreement.


Presentation Transcript

Slide1

Automated Identification of Abnormal Adult EEGs

A Thesis Proposal by:

Silvia

López de Diego

Neural Engineering Data Consortium

College of Engineering

Temple University

Philadelphia, Pennsylvania, USA

Slide2

Abstract

The interpretation of electroencephalograms (EEGs) is a process that is still dependent on the subjective analysis of the examiners. Though inter-rater agreement on critical events such as seizures can be high, it is much lower on subtler events (e.g., when there are benign variants). The focus of this study is to automatically classify normal and abnormal EEGs to provide neurologists with real-time decision support.

A demographically balanced subset of the TUH EEG Corpus was used to evaluate performance. The data, comprised of 200 abnormal EEGs and 202 normal EEGs was manually selected. This subset was partitioned into a training set (82 normal/80 abnormal) and an evaluation set (51 normal/55 abnormal). Principal Components Analysis (PCA) was used to reduce the dimensionality of the data. Two baseline classification algorithms were explored: k-Nearest Neighbor (kNN), Random Forest Ensemble Learning (RF). kNN achieved a 41.8% detection error rate while RF achieved an error rate of 31.7%. These error rates are significantly lower than those obtained by random guessing based on priors (49.5%). These algorithms were then compared to a Hidden Markov Models (HMM) based approach, which reduced the error rate to 17.0%, which is approaching human performance. Several deep learning architectures will also be explored in this thesis.

Slide3

Introduction

Slide4

Electroencephalography (EEG) refers to the recording of electrical activity along the scalp

It is used to treat conditions such as sleep disorders and epilepsy

Because EEG is noninvasive and relatively cheap, it is still used despite the emergence of technologies such as Magnetic Resonance Imaging (MRI)

Electroencephalography (EEG)

Slide5

Manual interpretation of an EEG is performed by a board-certified neurologist. It takes several years to receive this certification.

Interrater

agreement is low: the interpretation of an EEG depends somewhat on the training and subjective judgement of the examiner.

Increasing the interrater agreement for EEG interpretation is one of the advantages of an automated technique.

Manual Interpretation of EEGs

Slide6

The EEG interpretation task can be broken down in:

Recognition of transients: Events that include pathological and physiological waveforms, such as spike and sharp waves discharges

Analysis

of background: General characteristics present in all EEG recordings that are usually observed when making a normal/abnormal classification

Manual Interpretation of EEGs

Example of EEG Background

Example of EEG Transient

Slide7

Normal EEG Characteristics

The main characteristics of a normal EEG are the following:

Reactivity: Response to certain physiological changes or provocations.

Alpha Rhythm: Waves originated in the occipital lobe (predominantly), between 8-13 Hz and 15 to 45

μV

.

Mu Rhythm: Central rhythm of alpha activity commonly between 8-10 Hz visible in 17% to 19% of adults.

Beta Activity: Activities in the frequency bands of 18-25 Hz, 14-16 Hz and 35-40 Hz.

Theta Activity: Traces of 6-7 Hz activity present in the frontal or frontocentral regions of the brain.

The normal/Abnormal classification heavily depends on the frequency, presence or distortion of this feature. Its emergence during the closed-eyes period is known as Posterior Dominant Rhythm (PDR)

We decided to focus on this characteristic.

Slide8

Abnormal EEG Classification

Slide9

Automatic Abnormal EEG Classification

A general method for th

e for the classification of normal and abnormal EEGs is a task that has not been explored yet

Previous studies have focused on the classification of very specific conditions, such as the classification of athletes with residual functional deficits after a concussion

Most of these studies have not been conducted with clinical EEGs

This study proposes the establishment of a general method for the classification of normal and abnormal EEGs, which would be more useful in a clinical setting, where patients are evaluated for an ample number of conditions

To do this, the focus of the study will be the automatic analysis of the background EEG

Model

Features

Normal

Abnormal

Input

Output

Slide10

Background

Slide11

kNN

Model

Features

Normal

Abnormal

Input

Output

HMM

RF

Pilot Studies

Baseline System

The System

Slide12

Classification of Sequential Data

EEGs, like speech signals, are the product of a physiological process that unfolds in time

Machine learning approaches that treat the observations as

i.i.d

. would fail to exploit the sequential nature of the data

This, added to the success that Hidden Markov Models (HMMs) have shown in the area of speech recognition served as motivation for the selection of these model for the baseline system

Slide13

Hidden Markov Models (HMMs)

HMMs are a class of doubly stochastic processes in which discrete state sequences are modeled as Markov chains, but in this case, the system emits a visible observation, or symbol, in every state.

If

represents a sequence of feature vectors

, where

is the vector observed at time

, and

is the

event in a dictionary, the problem becomes the finding of the most probable event:

𝑎𝑟𝑔𝑚𝑎𝑥{𝑃(𝒀|𝒘)𝑃(𝒘)}


Slide14

Hidden Markov Models (HMMs)

If the system has N states, an L-component Gaussian Mixture Model (GMM), forward probability

backward probability

and probability that the model generates the symbol series

, the transition probability from

to

at time

is:

The estimation formulas for the transition probability are:

If

follows an

dimentional

normal distribution, then:


Where

is the average of the output vector,

the covariance and

and

represent the transpose and the inverse respectively


Slide15

HMMs and Deep Neural Networks (DNNs)

Advances in computer hardware and deep learning/machine learning algorithms have facilitated the faster training of Deep Neural Networks (DNNs)

There have been a series of breakthroughs in the area of automatic speech recognition. Deep Learning has surpassed the performance of HMMs in several speech recognition tasks, such as Switchboard, in which the error rate was decreased to 6.9%

With sufficient data, deep learning systems can significantly improve performance

Long Short Term

Corpus

Training Speech

SGMM WER

DNN WER

BABEL Pashto

10 hours

69.2%

67.6%

BABEL Pashto

80 hours

50.2%

42.3%

Fisher English

2000 hours

15.4%

10.3%

Slide16

Experimental Setup

Slide17

Data

The data used was a demographically balanced subset of the TUH EEG Corpus. The data was divided as follows:

Set

Normal

Abnormal

Training

82 EEGs

80 EEGs

Evaluation

51 EEGs

55 EEGs

Slide18

Experimental Design

Slide19

Random Forest and the Number of Trees

The performance of the systems higher than 20 trees are comparable to each other.

Taking performance and computational time for the classification into account, a number of 50 trees was chosen for the rest of the experiments.

Slide20

kNN: Tuning the System

The lowest k for the best operating interval was chosen.

This point corresponds to k = 20.

The best error rate achieved by the system is 41.79% for PCA = 86.

Slide21

Channel Comparison

This correlates with the information learned from neurologists about their reliance on occipital channels for the classification of EEGs.

The system was evaluated for the highlighted channels

The performance for the T5-O1 channel was better for all operating points with PCA dimensions higher than 20.

Slide22

Summary of Pilot Studies

Ref/

Hyp


Normal

Abnormal

Normal

50.49%

49.50

%

Abnormal

34.00%

66.00%

No.

System Description

Error

1

kNN (k = 20)

41.79%

3

RF (

Ntrees

= 50)

31.66%

Error Rates for the systems described so far:

Confusion Matrix for kNN:

Slide23

GMM-HMM Experiments

This set of experiments was conducted with the full set of features

The optimized system was then tested with the same feature input as the pilot experiments for comparison

The experiments can be summarized as follows:

Gaussian Mixture/HMM State Analysis

Signal Input Analysis

Channel Analysis

Slide24

GMM-HMM Experiments

# Gaussian Mixtures

# HMM States

Correct Detection (%)

1

1

69.81%

1

2

65.09%

1

3

65.09%

2

1

76.42%

2

2

80.19%

2

3

77.36%

3

1

76.42%

3

2

82.08%

3

3

83.02%

4

1

82.08%

4

2

64.15%

4

3

77.36%

Gaussian Mixture/HMM State Analysis Results:

Slide25

GMM-HMM Experiments: GM/HMM Analysis

Input (min)

#Gaussians/#HMM States

Correct Detection (%)

5

3/3

80.19%

10

3/3

83.02%

15

3/3

80.19%

20

3/3

79.25%

25

3/3

76.42%

Signal Input Analysis Results:

#Gaussians/#HMM States

Channel

Correct Detection (%)

3/3

Fp1-F7

80.19%

3/3

T5-O1

83.02%

3/3

F7-T3

80.19%

3/3

C3-Cz

79.25%

3/3

P3-O1

76.42%

Channel Analysis Results:

Slide26

Summary of Results

System Description

Error (%)

kNN (k=20)

41.80%

RF (Nt=50)

31.70%

PCA-HMM #GM = 3 #HMM States = 3)

25.64%

GMM-HMM (#GM = 3 #HMM States = 3)

16.98%

The table below shows a summary of the results obtained through the systems implemented so far:

Ref/

Hyp


Normal

Abnormal

Normal

78.18%

21.82

%

Abnormal

11.76%

88.24%

 Ref/

Hyp

Normal

Abnormal

Normal

50.49%

49.50

%

Abnormal

34.00%

66.00%

The GMM-HMM baseline system showed a significant decrease in the false alarm rate in comparison with the kNN system

The best GMM-HMM system will serve as a baseline for the normal/abnormal classification problem

kNN Confusion Matrix

GMM-HMM Confusion Matrix

Slide27

Timeline of Future Work

Slide28

GMM-HMM Experiments

December-January

Set up deep learning system for a second pass of deep learning after the GMM-HMM processing:

Implement and optimize a Stacked

Denoising

Autoencoders

(

SdA

) system for the classification and increase the number of channels that are taken into account for the classification decision.

Expand and evaluate the normal/abnormal TUH database subset:

Generate simple natural language processing (NLP) scripts to obtain EEG sessions that have been evaluated and classified by neurologists and form a larger, demographically balanced, subset of the data.

February

Implement a long short term memory system for the normal/abnormal classification of EEGs.

This system will be implemented with the

Theano Python library for deep learning and evaluated in the expanded dataset.

Evaluate the

SdA

implementation on the expanded dataset.

March-May

Complete the writing of the thesis and work on publications.

Defend this thesis.

Slide29

Biography: Silvia López de Diego

Silvia Lopez is currently an MS student in Temple University's Department of Electrical and Computer Engineering. Silvia earned a BS degree in Electrical engineering also from Temple University.

In 2013, she joined the Institute for Signal and Information Processing (ISIP) as an undergraduate research assistant, and contributed to the development of the TUH EEG Corpus, the largest publicly available clinical EEG database in the world. In 2015, she joined ISIP as a graduate research assistant to continue pursuing her interest in bioengineering applications of machine learning.

Silvia currently working on an NIH-funded project involving cohort retrieval of electronic medical records, and is developing technology for the automatic interpretation of EEG events.

Slide30

References

Azuma, H., Hori, S., Nakanishi, M., Fujimoto, S., Ichikawa, N., & Furukawa, T. A. (2003). An intervention to improve the interrater reliability of clinical EEG interpretations.

Psychiatry and Clinical Neurosciences

,

57

(5), 485–489. http://doi.org/10.1046/j.1440-1819.2003.01152.x

Cao, C., Tutwiler, R. L., &

Slobounov

, S. (2008). Automatic classification of athletes with residual functional deficits following concussion by means of EEG signal using support vector machine.

IEEE Transactions on Neural Systems & Rehabilitation Engineering

,

16

(4), 327–335. http://doi.org/10.1109/TNSRE.2008.918422Ebersole, J. S., & Pedley, T. A. (2014). Current practice of clinical electroencephalography (4th ed.). Philadelphia, Pennsylvania, USA: Wolters Kluwer. Retrieved from http://www.amazon.com/Current-Practice-Clinical-Electroencephalography-Ebersole/dp/145113195X

Gales, M., & Young, S. (2007). The Application of Hidden Markov Models in Speech Recognition.

Foundations and Trends® in Signal Processing, 1(3), 195–304. http://doi.org/10.1561/2000000004

Harati, A., Golmohammadi

, M., Lopez, S., Obeid, I., & Picone, J. (2015). Improved EEG event classification using differential energy. In 2015 IEEE Signal Processing in Medicine and Biology Symposium (SPMB) (pp. 1–4). Philadelphia: IEEE. http://doi.org/10.1109/SPMB.2015.7405421

Harati

, A., Lopez, S., Obeid, I., Jacobson, M.,

Tobochnik

, S., & Picone, J. (2014). THE TUH EEG CORPUS: A Big Data Resource for Automated EEG Interpretation. In

Proceedings of the IEEE Signal Processing in Medicine and Biology Symposium

(pp. 1–5). Philadelphia, Pennsylvania, USA. http://doi.org/http://www.isip.piconepress.com/publications/conference_proceedings/2014/ieee_spmb/tuh_eeg

Lopez, S., Suarez, G.,

Jungries

, D., Obeid, I., & Picone, J. (2015). Automated Identification of Abnormal EEGs. In IEEE Signal Processing in Medicine and Biology Symposium (pp. 1–4). Philadelphia, Pennsylvania, USA. http://doi.org/http://www.isip.piconepress.com/publications/conference_proceedings/2015/ieee_spmb/abnormal/