/
Figure S1. General gating and sorting strategies for Figure S1. General gating and sorting strategies for

Figure S1. General gating and sorting strategies for - PowerPoint Presentation

dora
dora . @dora
Follow
27 views
Uploaded On 2024-02-02

Figure S1. General gating and sorting strategies for - PPT Presentation

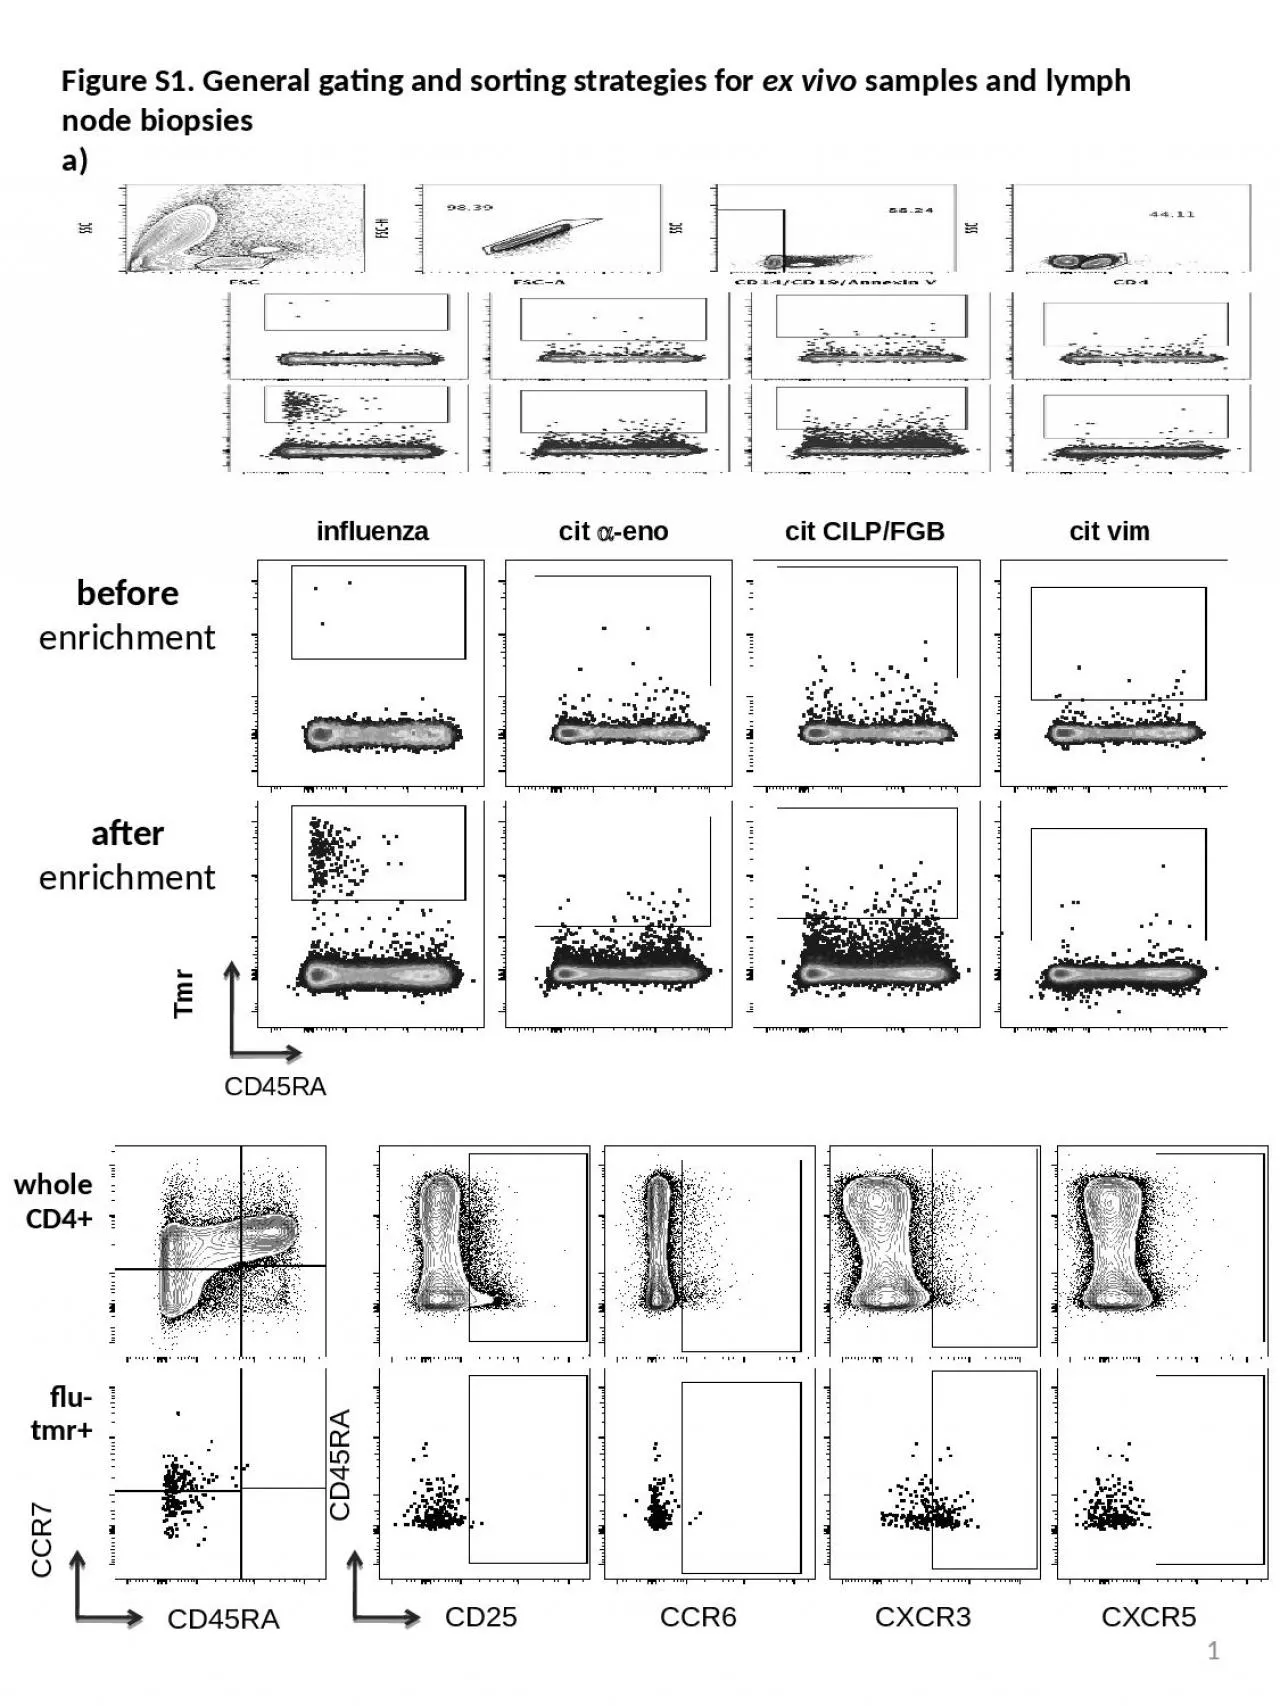
ex vivo samples and lymph node biopsies a Tmr CD45RA cit vim cit a eno cit CILPFGB influenza CCR7 CD45RA CD45RA CD25 whole CD4 flu tmr CCR6 CXCR3 CXCR5 1 ID: 1043676

cd4 cells tetramer specific cells cd4 specific tetramer general cilp positive follow memory patients antigen population fgb expression samples

Share:

Link:

Embed:

Download Presentation from below link

Download Presentation The PPT/PDF document "Figure S1. General gating and sorting st..." is the property of its rightful owner. Permission is granted to download and print the materials on this web site for personal, non-commercial use only, and to display it on your personal computer provided you do not modify the materials and that you retain all copyright notices contained in the materials. By downloading content from our website, you accept the terms of this agreement.


Presentation Transcript

1. Figure S1. General gating and sorting strategies for ex vivo samples and lymph node biopsiesa)TmrCD45RAcit vimcit a-enocit CILP/FGBinfluenzaCCR7CD45RACD45RA CD25 whole CD4+flu-tmr+ CCR6 CXCR3 CXCR51beforeenrichmentafterenrichment

2. TmrCD4cit vimcit a-enocit CILP/FGBb)2Figure S1. General gating and sorting strategies for ex vivo samples (a) and lymph node biopsies (b)a+b) Lymphocytes were gated, followed by selection of single cells and removal of B cells, monocytes and apoptotic cells. CD4+ cells were thereafter screened for tetramer-positive cells. Here, we used Boolean gating to get single-tetramer-positive events and to exclude double-tetramer-positive events between the four different tetramer-channels. General gates for all the phenotypic markers were first set for the CD4+ population and then copied to respective tetramer-positive populations. For ex vivo samples (a) tetramer-positive gates were set considering the flow plots of the samples before enrichment to determine the general background. For lymph node biopsies (b) we set the tetramer-positive gates directly due to the lack of enrichment when doing in vitro staining.

3. Figure S2a)3Figure S2. Characterization of antigen-specific CD4+ T cells by differentiation status, determined by simultaneous or singular expression of CD45RA and CCR7 in naïve, central and effector memory and terminal effector memory T cells Box plots show the mean distribution of antigen-specific T cells among the four phenotypes. Central memory (Tcm) and effector memory (Tem) T cells are coloured in red and salmon, respectively.a) For CILP/FGB- and α-enolase-specific T cells from the repeat experiments on the four healthy controls. b) For influenza- and citrulline-specific T cells as well as in detail for CILP/FGB- and α-enolase-reactive T cells from the experiments done on the 14 cross-sectional RA patients.c) For the general CD4+ population and influenza-specific T cells (left panel) and the three channels of citrulline-reactive T cells from the ten LURA cohort patients both at baseline and 6m follow-up.

4. 4Figure S3.a)b)Figure S3. Characterization of antigen-specific CD4+ T cells found in early RA patients at baseline and follow-up by expression of CD25, CD38, CCR6, CXCR3 and CXCR5a) Phenotypic characterization of antigen-specific CD4+ T cells according to simultaneous or singular expression of CD45RA and CCR7 in naive (Tnaive) and CD45RA+ effector memory (Temra) T cells. Plotted are frequencies and the mean for α-enolase-, CILP/FGB-, vimentin- and influenza-specific T cells as well as the general CD4+ population at 0m (squares) and 6m follow-up (triangles). Green symbols depict the patients that achieved clinical remission at follow-up.b) Phenotypic characterization of antigen-specific CD4+ T cells according to expression of CD25, CD38, CCR6, CXCR3 and CXCR5. Plotted are frequencies for α-enolase- (squares), CILP/FGB- (diamonds), vimentin- (circles) and influenza- (triangles) specific T cells and the general CD4+ population (open, inverted triangles) at baseline and 6m follow-up. Green symbols depict the patients that achieved clinical remission at follow-up.

5. 5