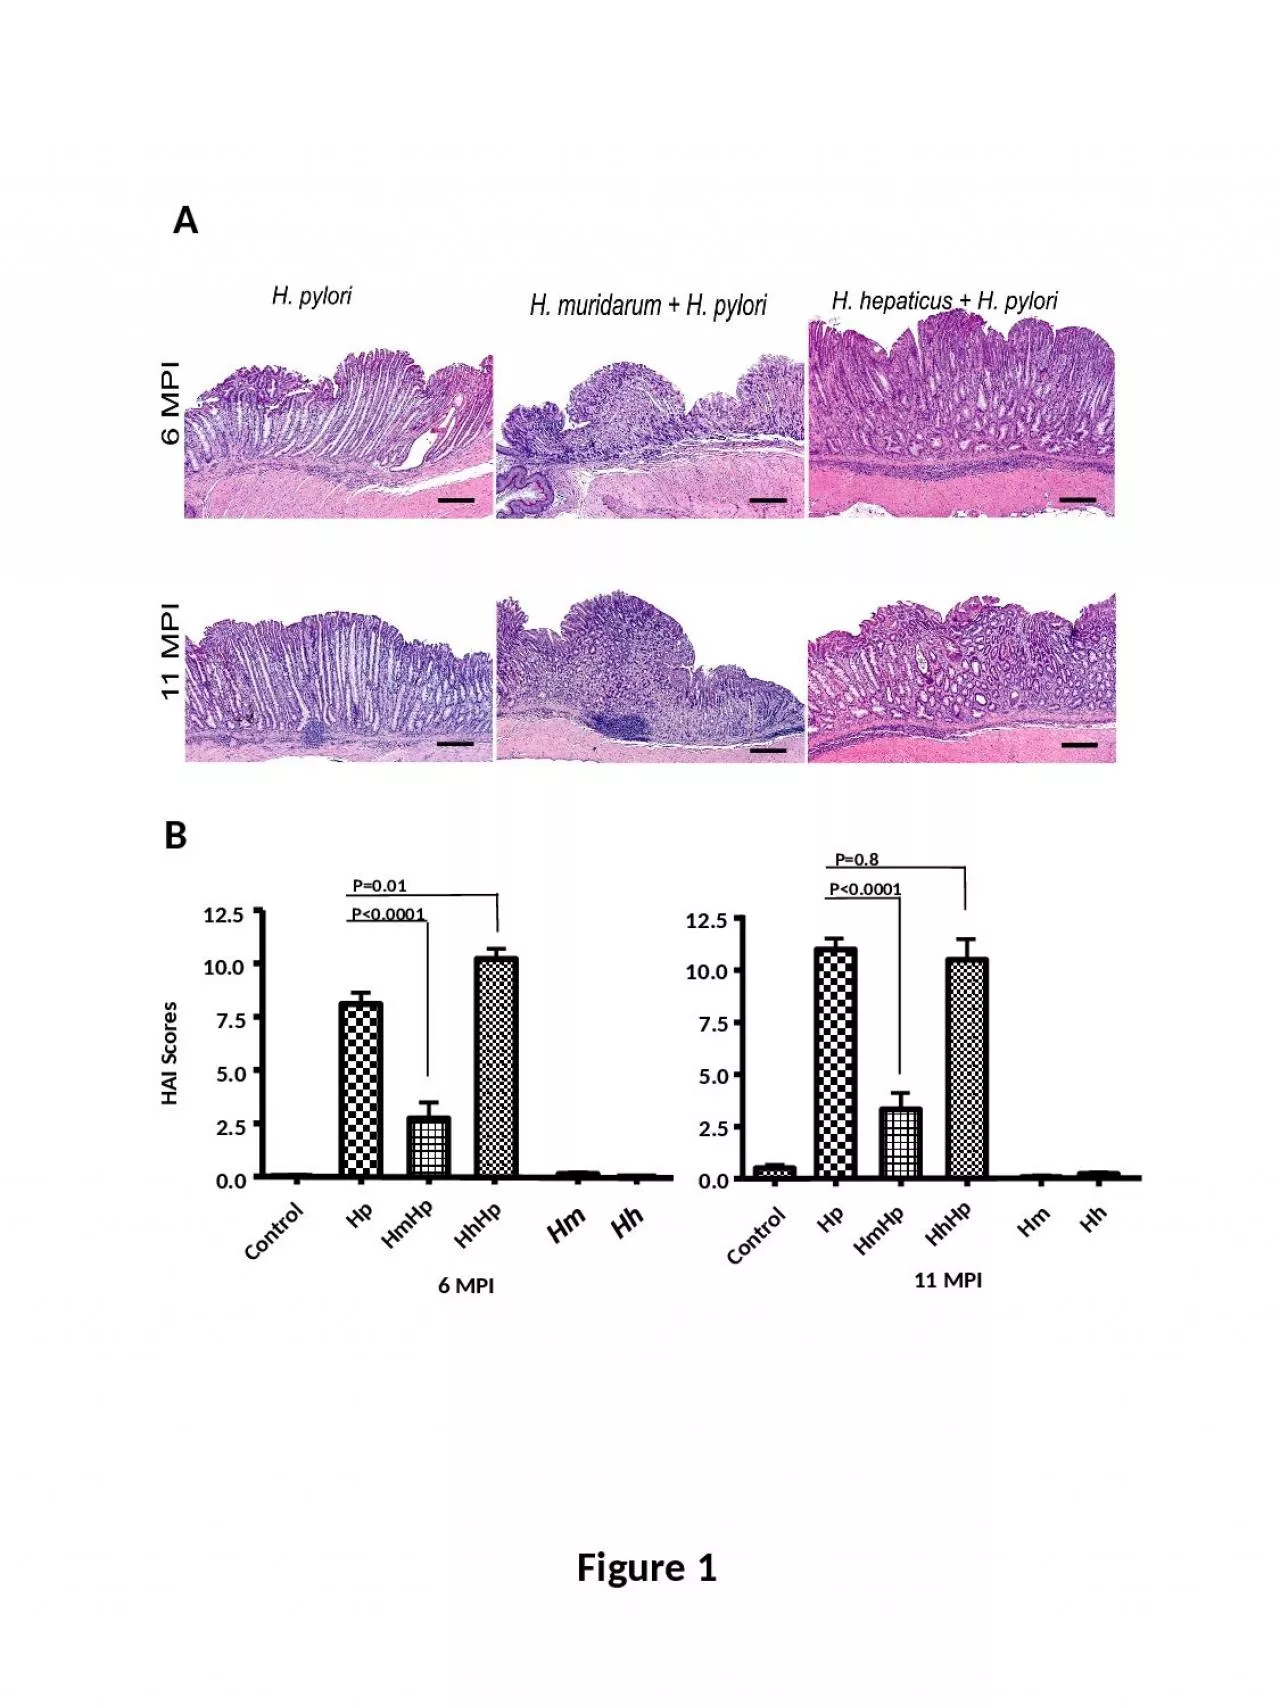
/
HmHp HhHp HAI Scores P=0.01 HmHp HhHp HAI Scores P=0.01

HmHp HhHp HAI Scores P=0.01 - PowerPoint Presentation

dora
dora . @dora
Follow
64 views
Uploaded On 2024-01-29

HmHp HhHp HAI Scores P=0.01 - PPT Presentation

Plt00001 Plt00001 P08 11 MPI Control Hp Hm Hh 00 25 50 75 100 125 6 MPI Control Hp Hm Hh HmHp HhHp 00 25 50 75 100 125 B Figure 1 A Ifn Sham ID: 1042260

0001 0001p shamhphmhmhphhhhhp 11hmhp 0001p 0001 11hmhp shamhphmhmhphhhhhp 6hhhp figure gastric 6hmhp colonization 6hm 11hm 6hh 012 510 11hhhp

Share:

Link:

Embed:

Download Presentation from below link

Download Presentation The PPT/PDF document "HmHp HhHp HAI Scores P=0.01" is the property of its rightful owner. Permission is granted to download and print the materials on this web site for personal, non-commercial use only, and to display it on your personal computer provided you do not modify the materials and that you retain all copyright notices contained in the materials. By downloading content from our website, you accept the terms of this agreement.


Presentation Transcript

1. HmHpHhHpHAI ScoresP=0.01P<0.0001P<0.0001P=0.811 MPIControlHpHmHh0.02.55.07.510.012.56 MPIControlHpHmHhHmHpHhHp0.02.55.07.510.012.5BFigure 1A

2. Ifn-ShamHpHmHmHpHhHhHp-10-50510152070758085P<0.0001P<0.0001Il-1ShamHpHmHmHpHhHhHp-4-3-2-10123456P<0.0001P=0.076Tnf-ShamHpHmHmHpHhHhHp-1001020P<0.0001P<0.0001Figure 2************P<0.0001P<0.0001*******************P<0.0001

3. Il-17A6 MPIHAIP<0.0001, r2=0.92P=0.0018, r2=0.82HAIIl-17AGastric IL17A mRNA levelsFold change compared to sham controlCHpHmHpHhHpHmHh0255075100125150HbHpHb-106 MPI11 MPIP=0.2P=0.059P=0.018P=0.025P=0.0002P=0.018HpHmHpHhHpHmHbHpHbCHhAB11 MPIFigure 3*********************P=0.0031P=0.0011P<0.0001P<0.0001********

4. Figure 4*********P=0.0005P=0.019**********P=0.00156P=0.045P=0.0016 MPI11 MPI

5. HhHp-6HhHp-11HmHp-6HmHp-11Hp-6Hp-11100101102103104105106107108Numbers of gastric Hp per g mouse DNA#####Figure 5

6. Cecal colonization of Hh and HmHhHmHh-6Hh-11HhHp-6HhHp-11Hm-6Hm-11HmHp-6HmHp-11101102103104105106107108CecumFigure 6Gastric colonization of Hh and HmHh-6Hh-11HhHp-6HhHp-11Hm-6Hm-11HmHp-6HmHp-11100101102103104105106107108HhHmStomachAB

7. Hp infectionsAntigensAPCs (DC, Macrophages)Th17 PathwaysTreg cellsIntestineStomachTh1 Pathway+Hp Gastric pathologyHm or HbAttenuated Gastric pathologyHhTh17-AntigensHhTh17cellsHp sTreg cells+Aggravated or comparableGastric pathology PI iPI AIHp Figure 7