/
TL1 Team Approach to Predicting Response to Spinal Cord Stimulation for Chronic Low Back TL1 Team Approach to Predicting Response to Spinal Cord Stimulation for Chronic Low Back

TL1 Team Approach to Predicting Response to Spinal Cord Stimulation for Chronic Low Back - PowerPoint Presentation

elena
elena . @elena
Follow
0 views
Uploaded On 2024-03-13

TL1 Team Approach to Predicting Response to Spinal Cord Stimulation for Chronic Low Back - PPT Presentation

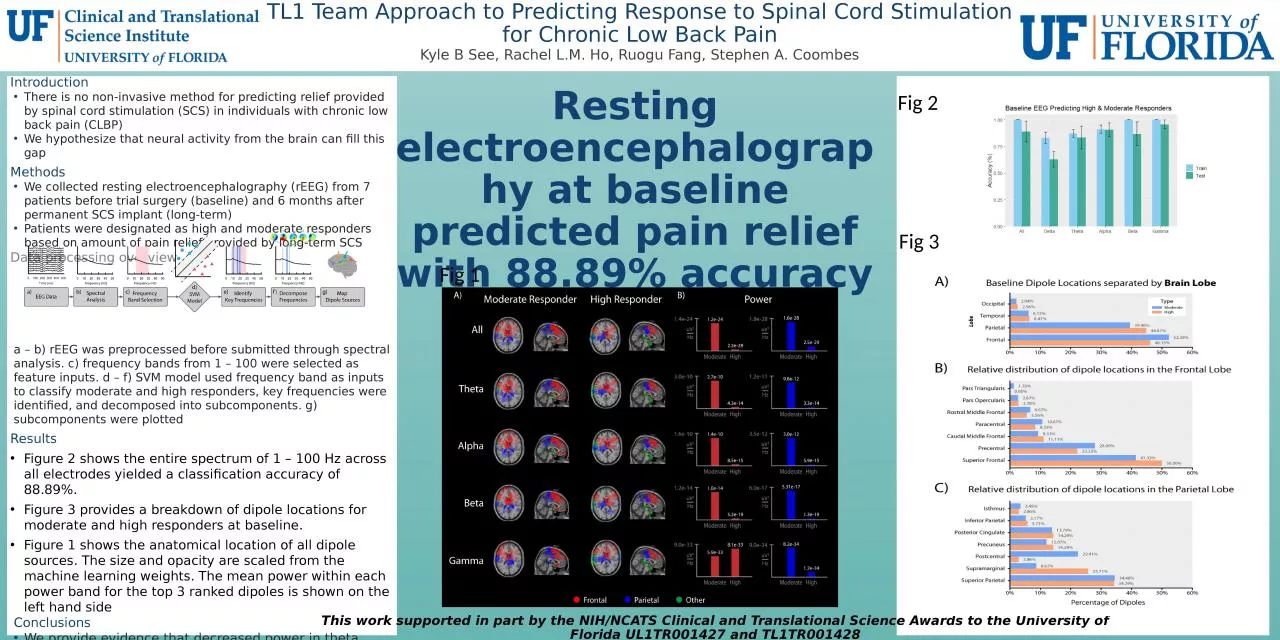
Kyle B See Rachel LM Ho Ruogu Fang Stephen A Coombes Introduction There is no noninvasive method for predicting relief provided by spinal cord stimulation SCS in individuals with chronic low back pain CLBP ID: 1046862

pain relief term moderate relief pain moderate term predicting scs power baseline responders long high reeg patients regions fig

Share:

Link:

Embed:

Download Presentation from below link

Download Presentation The PPT/PDF document "TL1 Team Approach to Predicting Response..." is the property of its rightful owner. Permission is granted to download and print the materials on this web site for personal, non-commercial use only, and to display it on your personal computer provided you do not modify the materials and that you retain all copyright notices contained in the materials. By downloading content from our website, you accept the terms of this agreement.


Presentation Transcript

1. TL1 Team Approach to Predicting Response to Spinal Cord Stimulation for Chronic Low Back PainKyle B See, Rachel L.M. Ho, Ruogu Fang, Stephen A. CoombesIntroductionThere is no non-invasive method for predicting relief provided by spinal cord stimulation (SCS) in individuals with chronic low back pain (CLBP)We hypothesize that neural activity from the brain can fill this gap MethodsWe collected resting electroencephalography (rEEG) from 7 patients before trial surgery (baseline) and 6 months after permanent SCS implant (long-term)Patients were designated as high and moderate responders based on amount of pain relief provided by long-term SCSData processing overviewa – b) rEEG was preprocessed before submitted through spectral analysis. c) frequency bands from 1 – 100 were selected as feature inputs. d – f) SVM model used frequency band as inputs to classify moderate and high responders, key frequencies were identified, and decomposed into subcomponents. g) subcomponents were plottedResultsFigure 2 shows the entire spectrum of 1 – 100 Hz across all electrodes yielded a classification accuracy of 88.89%. Figure 3 provides a breakdown of dipole locations for moderate and high responders at baseline.Figure 1 shows the anatomical location of all dipole sources. The size and opacity are scaled from the machine learning weights. The mean power within each power band for the top 3 ranked dipoles is shown on the left hand sideConclusionsWe provide evidence that decreased power in theta, alpha, and beta in the anterior regions of the parietal cortex and posterior regions of the frontal cortex can be harnessed for predicting long-term pain relief from burst SCS.This work supported in part by the NIH/NCATS Clinical and Translational Science Awards to the University of Florida UL1TR001427 and TL1TR001428Resting electroencephalography at baseline predicted pain relief with 88.89% accuracyFig 2 Fig 3 Fig 1