/
Snellens Chart Snellens Chart

Snellens Chart - PDF document

eliza
eliza . @eliza
Follow
343 views
Uploaded On 2022-09-20

Snellens Chart - PPT Presentation

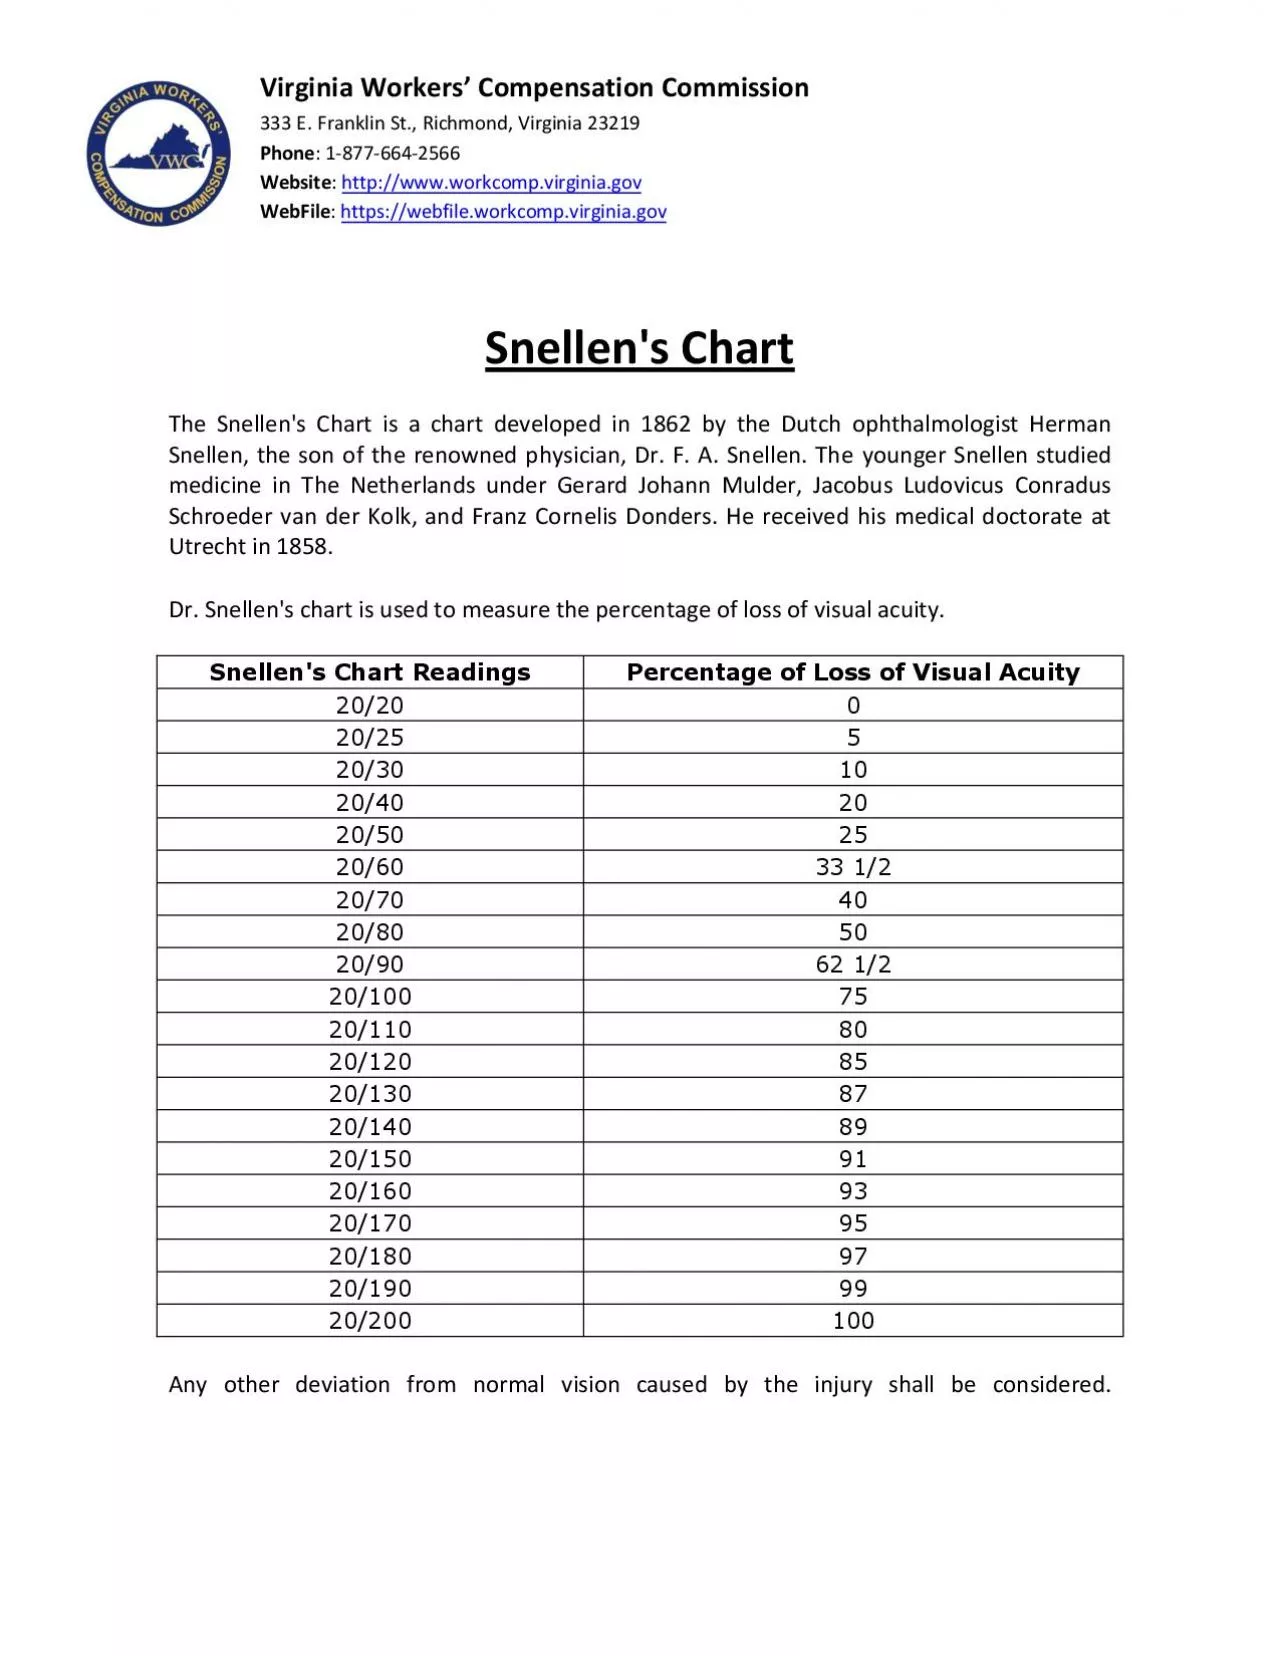
The Snellens Chart is a chart developed in 1862 by the Dutch ophthalmologist Herman Snellen the son of the renowned physician Dr F A Snellen The younger Snellen studied medicine in The Nethe ID: 954266

chart snellen 100 virginia snellen chart virginia 100

Share:

Link:

Embed:

Download Presentation from below link

Download Pdf The PPT/PDF document "Snellens Chart" is the property of its rightful owner. Permission is granted to download and print the materials on this web site for personal, non-commercial use only, and to display it on your personal computer provided you do not modify the materials and that you retain all copyright notices contained in the materials. By downloading content from our website, you accept the terms of this agreement.


Presentation Transcript

Snellen's Chart The Snellen's Chart is a chart developed in 1862 by the Dutch ophthalmologist Herman Snellen, the son of the renowned physician, Dr. F. A. Snellen. The younger Snellen studied medicine in The Netherlands under Gerard Johann Mulder, Jacobus Ludovicus Conradus Schroeder van der Kolk, and Franz Cornelis Donders. He received his medical doctorate at Utrecht in 1858. Dr. Snellen's chart Snellen's Chart Readings Percentage of Loss of Visual Acuity 20/20 0 20/25 5 20/30 10 20/40 20 20/50 25 20/60 33 1/2 20/70 40 20/80 50 20/90 62 1/2 20/100 75 20/110 80 20/120 85 20/130 20/140 89 20/150 91 20/160 93 95 20/180 97 20/190 99 20/200 100 Any other deviation from normal vision caused by the injury shall be considered. Virginia Workers’ Compensation333 E. Franklin St., Richmond, Virginia 23219