/
Moisture Pulse-Reserve Behavior Across Biomes Moisture Pulse-Reserve Behavior Across Biomes

Moisture Pulse-Reserve Behavior Across Biomes - PowerPoint Presentation

ella
ella . @ella
Follow
66 views
Uploaded On 2023-10-27

Moisture Pulse-Reserve Behavior Across Biomes - PPT Presentation

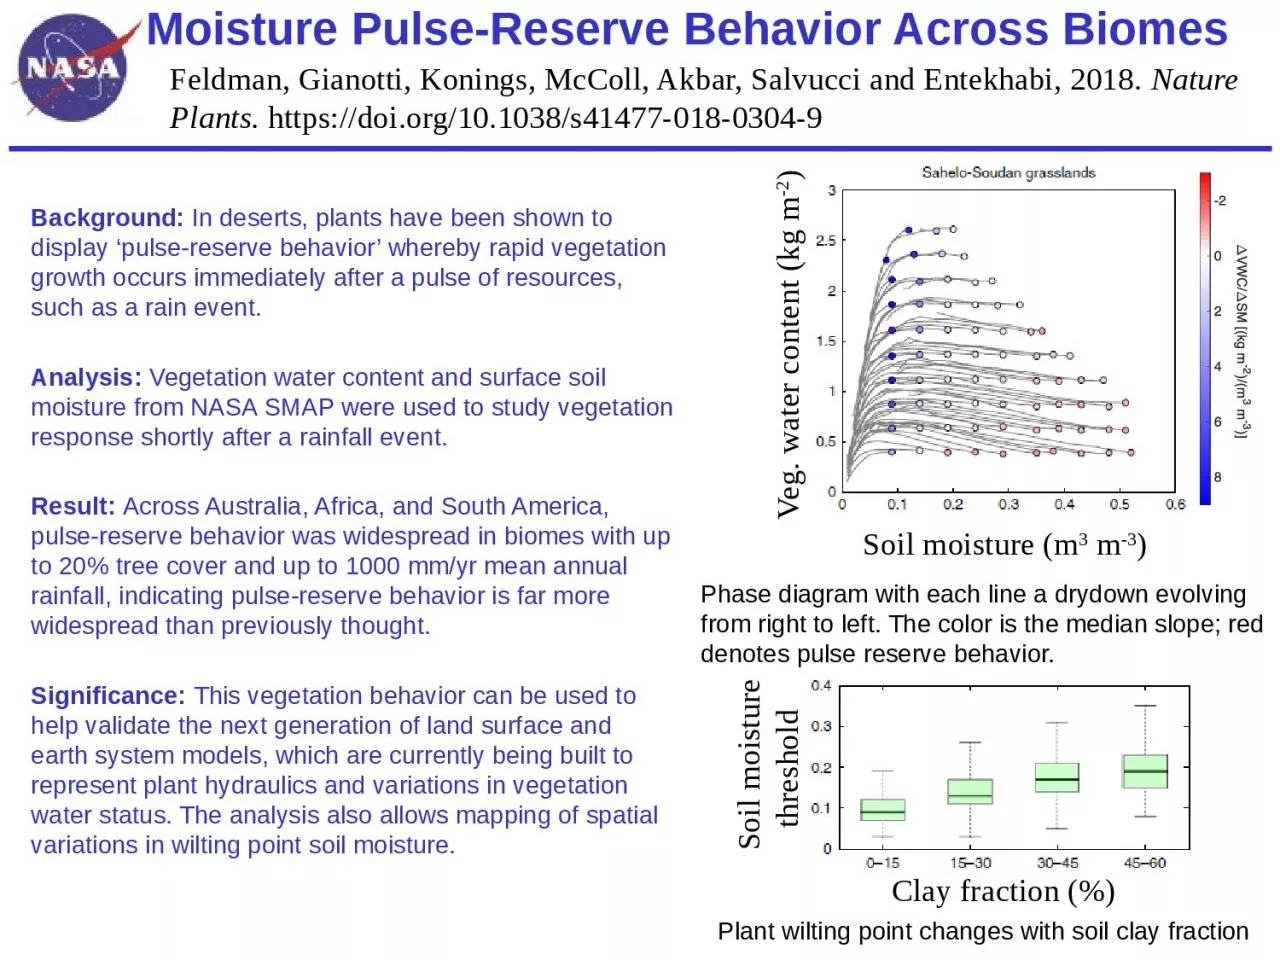
Feldman Gianotti Konings McColl Akbar Salvucci and Entekhabi 2018 Nature Plants httpsdoiorg101038s4147701803049 Background In deserts plants have been shown to display pulsereserve behavior whereby rapid vegetation growth occurs immediately after a pulse ID: 1025676

moisture pulse reserve soil pulse moisture soil reserve behavior vegetation water variations event analysis wilting point content surface plant

Share:

Link:

Embed:

Download Presentation from below link

Download Presentation The PPT/PDF document "Moisture Pulse-Reserve Behavior Across B..." is the property of its rightful owner. Permission is granted to download and print the materials on this web site for personal, non-commercial use only, and to display it on your personal computer provided you do not modify the materials and that you retain all copyright notices contained in the materials. By downloading content from our website, you accept the terms of this agreement.


Presentation Transcript

1. Moisture Pulse-Reserve Behavior Across BiomesFeldman, Gianotti, Konings, McColl, Akbar, Salvucci and Entekhabi, 2018. Nature Plants. https://doi.org/10.1038/s41477-018-0304-9Background: In deserts, plants have been shown to display ‘pulse-reserve behavior’ whereby rapid vegetation growth occurs immediately after a pulse of resources, such as a rain event. Analysis: Vegetation water content and surface soil moisture from NASA SMAP were used to study vegetation response shortly after a rainfall event. Result: Across Australia, Africa, and South America, pulse-reserve behavior was widespread in biomes with up to 20% tree cover and up to 1000 mm/yr mean annual rainfall, indicating pulse-reserve behavior is far more widespread than previously thought. Significance: This vegetation behavior can be used to help validate the next generation of land surface and earth system models, which are currently being built to represent plant hydraulics and variations in vegetation water status. The analysis also allows mapping of spatial variations in wilting point soil moisture.Phase diagram with each line a drydown evolving from right to left. The color is the median slope; red denotes pulse reserve behavior. Soil moisture (m3 m-3)Veg. water content (kg m-2)Plant wilting point changes with soil clay fractionClay fraction (%)Soil moisture threshold