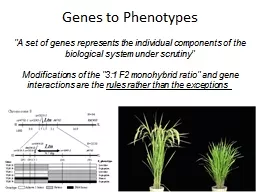
/

"A set of genes represents the individual components of the - PowerPoint Presentation

ellena-manuel
ellena-manuel . @ellena-manuel
Follow
375 views
Uploaded On 2017-03-17

"A set of genes represents the individual components of the - PPT Presentation

Modifications of the 31 F2 monohybrid ratio and gene interactions are the rules rather than the exceptions   Genes to Phenotypes One gene one polypeptide Many alleles are possible in a population but in a diploid individual there are only two alleles ID: 525289

allele locus genetic vrn locus allele vrn genetic genes parents cyanide heterosis sensitivity white parent recessive dominance vernalization temperature

Share:

Link:

Embed:

Download Presentation from below link

Download Presentation The PPT/PDF document ""A set of genes represents the individua..." is the property of its rightful owner. Permission is granted to download and print the materials on this web site for personal, non-commercial use only, and to display it on your personal computer provided you do not modify the materials and that you retain all copyright notices contained in the materials. By downloading content from our website, you accept the terms of this agreement.


Presentation Transcript

Slide1

"A set of genes represents the individual components of the biological system under scrutiny"Modifications of the "3:1 F2 monohybrid ratio" and gene interactions are the rules rather than the exceptions  

Genes to PhenotypesSlide2

One gene - one polypeptide??Slide3

Many alleles are possible in a population, but in a diploid individual, there are only two alleles

Mutation is the source of new alleles

There are many levels of allelic variation, e.g.

DNA sequence changes with no change in phenotype

Large differences in phenotype due to effects at the transcriptional, translational, and/or post-translational levels

Transposable element activity

Allelic VariationSlide4

How many alleles are possible? Vrs1 Komatsuda et al. (2007) PNAS 104: 1424-1429Slide5

Complete dominance: Deletion

, altered transcription, alternative translation. The interesting case of aroma in rice: a loss of function makes rice smell great, and patent attorneys salivate....

Allelic Relationships at

a locus Slide6

Incomplete (partial) dominance


Example

: Red x White gives a pink F1. The F2 phenotypes are 1 Red: 2 Pink: 1 White.

Explanation

: Red pigment is formed by a complex series of enzymatic reactions. Plants with the dominant allele at the

I locus produce an enzyme critical for pigment formation. Individuals that are ii

produce an inactive enzyme and thus no pigment. In this case,

II

individuals produce twice as much pigment as

Ii

individuals and

ii

individuals produce none. The amount of pigment produced determines the intensity of flower color.

Allelic Relationships at a locus Slide7

Incomplete (partial) dominance


Example

: Red x White gives a pink F1. The F2 phenotypes are 1 Red: 2 Pink: 1 White.

Perspectives

: Enzymes are catalytic and heterozygotes usually produce enough enzyme to give normal phenotypes. This is the basis for complete dominance. However, upon closer examination, there are often measurable differences between homozygous dominant and heterozygous individuals. Thus, the level of dominance applies only to a specified phenotype.

Allelic Relationships at a locus Slide8

CodominanceAn application of electrophoresis is to separate proteins or DNA extracted from tissues or whole organisms. An electric charge is run through the supporting media (gel) in which extracts, containing proteins or DNA for separation, are placed. Proteins or DNA fragments are allowed to migrate across the gel for a specified time and then stained with specific chemicals or visualized via isotope or fluorescent tags. Banding patterns are then interpreted with reference to appropriate standards. The mobility of the protein or DNA is a function of size, charge and shape.

Allelic

Relationships at a locus Slide9

Allelic Relationships at a locus Cross two lines together and the F1 deviates significantly from the mid-parent

Segregation and independent assortment in F2

OverdominanceSlide10

Mid-ParentHybrid Vigor (Heterosis)

aa

AA

Aa

Additive

effect

-a

Dominance effect

d

P1

P2

F1

Single Gene Model

Yield

Additive

effect

a

mSlide11

HeterosisSignificantly exceed mid-parentF1 > (P1+P2)/2; AA>Aa>(0.5*(AA+aa

))>aa

Significantly exceed best parentF1 > P1;

Aa

>AA>

aa

Most commercially usefulSlide12

Cause of HeterosisOver-dominance theoryHeterozygous advantage, d > aF1’s always better than inbredsDispersed dominant genes theoryCharacter controlled by a number of genesFavourable alleles dispersed amongst parents (d ≤ a

)Can develop inbreds as good as F1Slide13

Dispersed DominanceCompletely dominant genes shared by parentsMaximum heterosis when parents are fixed for opposite alleles and dominance is completeP2aabbCCDD1 +1 +2 +2

F1

AaBbCcDd2+2+2 +2

P1

AABBccdd

2+2+1+1

xSlide14

The molecular basis of heterosisSchnable, P., and N. Springer. 2013. Progress toward understanding heterosis in crop plants.

Annu. Rev. Plant Biol.64:71-88

Involves structural variation:SNPs and INDELs

SV (structural variation)

CV (copy number variation)

PAV (presence/absence variation)

Involves differences in expression level: The majority of genes differentially expressed between parents expressed at mid-parent level In the F1Some non-additive expressionInvolves epigenetics Slide15

The molecular basis of heterosisSchnable, P., and N. Springer. 2013. Progress toward understanding heterosis in crop plants. Ann. Rev. Plant Biol.64:71-88

Conclusions:

No simple, unifying explanation for heterosisSpecies, cross, trait specificity

Extensive functional intra-specific variation for genome content

and expression

Heterosis generally the result of the action of multiple loci:

quantitative inheritance Slide16

Epistasis: Interaction between alleles at different loci

Example:

Duplicate recessive epistasis

(Cyanide production in white clover).

Identical phenotypes are produced when either locus is homozygous recessive (A-bb;

aaB

-), or when both loci are homozygous recessive (aabb).

Non-Allelic InteractionsSlide17

Parental, F1, and F2 phenotypes:Parent 1            x           Parent 2

(

low cyanide)            (low cyanide

)

F1

(

high cyanide)  F2 (9 high cyanide : 7 low cyanide)

Duplicate Recessive Epistasis

Cyanide Production in white cloverSlide18

AAbbaaBBx

AaBb

AB

Ab

aB

ab

AB

AABB

AABb

AaBB

AaBb

Ab

AABb

AAbb

AaBb

Aabb

aB

AaBB

AaBb

aaBB

aaBb

ab

AaBb

Aabb

aaBb

aabb

Low Cyanide

Low Cyanide

High Cyanide

F1

F2

9 High

:

7 Low Cyanide

Duplicate Recessive Epistasis

Doubled Haploid Ratio??Slide19

Precursor

®

 Enzyme 1

(AA;

Aa

)  

®  Glucoside ® 

Enzyme 2

(BB; Bb)

®

Cyanide

If Enzyme 1 =

aa

; end pathway and accumulate

Precursor

; if Enzyme 2 = bb; end pathway and accumulate

Glucoside

Duplicate Recessive EpistasisSlide20

Selfing the F1 gives a ratio of 12 white, 3 yellow and 1 green fruited plants

Dominant Epistasis

Example:

Fruit color in summer squash (

Cucurbita

pepo)Plant 1 has white fruit and Plant 2 has yellow fruit; the F1 of a cross between them has yellow fruit

xSlide21

Example: Fruit colour in summer squash (Cucurbita pepo)

Dominant Epistasis

WWyy

wwYY

x

AaBb

WY

Wy

wY

wy

WY

WWYY

WWYy

WwYY

WwYy

Wy

WWYy

Wwyy

WwYy

Wwyy

wY

WwYY

WwYy

wwYY

wwYy

wy

WwYy

Wwyy

wwYy

wwyy

White Fruit

Yellow Fruit

White Fruit

F1

F2

A Dominant allele at the W locus suppresses the expression of any allele at the Y locus

W is

epistatic

to Y or y to give a 12:3:1 ratioSlide22

Gene Interaction

Control Pattern

A-B-

A-bb

aaB

-

aabb

Ratio

Additive

No interaction

between loci

9

3

3

1

9:3:3:1

Duplicate Recessive

Dominant allele from each locus required

9

3

3

1

9:7

Duplicate

Dominant allele from each locus needed

9

3

3

1

9:6:1

Recessive

Homozygous recessive at one locus masks second

9

3

3

1

9:3:4

Dominant

Dominant allele at one locus masks other

9

3

3

1

12:3:1

Dominant Suppression

Homozygous recessive

allele at dominant suppressor locus needed

9

3

3

1

13:3

Duplicate Dominant

Dominant allele at either of two

loci needed

9

3

3

1

15:1

Dihybrid

F2 ratios with and without epistasis Slide23

Gene Interaction

Control Pattern

AABB

AAbb

aaBB

aabb

Ratio

Additive

No interaction

between loci

1

1

1

1

1:1:1:1

Duplicate Recessive

Dominant allele from each locus required

1

1

1

1

1:3

Duplicate

Dominant allele from each locus needed

1

1

1

1

1:2:1

Recessive

Homozygous recessive at one locus masks second

1

1

1

1

1:1:2

Dominant

Dominant allele at one locus masks other

1

1

1

1

2:1:1

Dominant Suppression

Homozygous recessive

allele at dominant suppressor locus needed

1

1

1

1

3:1

Duplicate Dominant

Dominant allele at either of two

loci needed

1

1

1

1

3:1

Dihybrid

doubled haploid ratios with and without epistasis Slide24

Vernalization sensitivity in cerealsEpistasis(and epigenetics) Slide25

The phenotype: Vernalization requirement/sensitivity Exposure to low temperatures necessary for a timely transition from the vegetative to the reproductive growth stage Why of interest?

Flowering biology = productivity

Correlated with low temperature toleranceLow temperature tolerance require for winter survival

Many regions have winter precipitation patterns

Fall-planted, low temperature-tolerant cereal crops:

a tool for dealing with the effects climate changeSlide26

The genotype: Vernalization requirement/sensitivity Three locus epistatic interaction: VRN-H1, VRN-H2, VRN-H3

Takahashi and Yasuda (1971)

7:1 ratio (DH) Slide27

A model for intra-locus

repression and expression Slide28

Genetics of vernalization sensitivity Alternative functional alleles (intron 1): VRN-H1Chromatin remodeling: VRN-H1

Gene deletion:

VRN-H2Copy number variation: VRN-H3 Slide29

Understanding what Takahashi and Yasuda created, and genetic dissection of the relationships between vernalization sensitivity and low temperature toleranceCuesta-Marcos et al. (2015) SNP genotypes of parents and each

isogenic line - in linkage

map orderThe barley genome sequenceGene expression

Low temperature tolerance

and

vernalization sensitivity phenotypic data Slide30

Making an isogenic lineTakahashi and Yasuda created the multiplebarley vernalization isogenic lines with 11 backcrosses!

http://themadvirologist.blogspot.com/2017/01/what-is-isogenic-line-and-why-should-it.htmlSlide31

Graphical SNP genotypes for the single locus VRN isogenic lines Blue = recurrent parent; red = donor parent ; pink = monomorphic SNPs

Map-ordered SNPs reveal defined introgressions on target chromosomes

Alignment with genome sequence allows estimates of gene number and content within introgressions

Estimate genetic (5 – 30 cM) and physical (7 – 50 Mb) sizes of introgressionsSlide32

Gene annotations for the

VRN-H2

genes present in the winter parent and absent in the spring donor (deletion allele)

No flowering time or low temperature tolerance–related genes in the

VRN-H2

introgression

Can we therefore have the VRN-H2 deletion and maintain cold tolerance?

17 predicted genesSlide33

No significant loss in low temperature tolerance with the VRN-H2 deletionSlide34

VRN allele architecture, vernalization sensitivity and low temperature tolerance

Takahashi and Yasuda (1971)

Cuesta-Marcos et al. (2015)

7:1 ratio (DH)

Facultative

Growth habit Slide35

Climate change: Facultative growth habit

Fall planting

Cold tolerance

o

n demand

Spring planting

Cold tolerance not needed Slide36

Facultative growth habit – are you ready for THE CHANGE? How? “Just say no” to vernalization sensitivity with the “right” VRN-H2

allele

A complete deletion“Just say yes” to short day photoperiod sensitivity with the “right” photoperiod sensitivity allele (PPD-H2)

“Ensure” a winter haplotype at all low temperature tolerance loci

Fr-H1, FR-H2

, and

FR-H3 plus…. a continual process of discovery Slide37

Mendelian genetic analysis: the "classical" approach to understanding the genetic basis of a difference in phenotype is to use progeny to understand the parents.If you use progeny to understand parents, then you make crosses between parents to generate progeny populations of different filial (F) generations: e.g. F1, F2, F3; backcross; doubled haploid; recombinant inbred, etc. 

Necessary parameters for genetic analysisSlide38

Mendelian genetic analysis: the "classical" approach to understanding the genetic basis of a difference in phenotype is to use progeny to understand the parents.The genetic status (degree of homozygosity) of the parents will determine which generation is appropriate for genetic analysis and the interpretation of the data (e.g. comparison of observed vs. expected phenotypes or genotypes).

The degree of

homozygosity of the parents will likely be a function of their mating biology, e.g. cross vs. self-pollinated.

Necessary parameters for genetic analysisSlide39

Mendelian genetic analysis: the "classical" approach to understanding the genetic basis of a difference in phenotype is to use progeny to understand the parents.Mendelian analysis is straightforward when one or two genes determine the trait.

Expected and observed ratios in cross progeny will be a function of

the degree of homozygosity of the parents

the generation studied

the degree of dominance the degree of interaction between genes the number of genes determining the trait

Necessary parameters for genetic analysi

s