/
Obtaining Five Nines  of Availability for Internet Services Tzvi Chumash tzvikacs Obtaining Five Nines  of Availability for Internet Services Tzvi Chumash tzvikacs

Obtaining Five Nines of Availability for Internet Services Tzvi Chumash tzvikacs - PDF document

ellena-manuel
ellena-manuel . @ellena-manuel
Follow
433 views
Uploaded On 2014-12-12

Obtaining Five Nines of Availability for Internet Services Tzvi Chumash tzvikacs - PPT Presentation

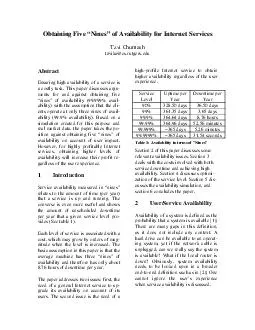
rutgersedu Abstract Ensuring high availability of a service is a costly task This paper discusses argu ments for and against obtaining five nines of availability 99999 avail ability with the assumption that the cli ents operate at only three nines of ID: 22402

rutgersedu Abstract Ensuring high availability

Share:

Link:

Embed:

Download Presentation from below link

Download Pdf The PPT/PDF document "Obtaining Five Nines of Availability fo..." is the property of its rightful owner. Permission is granted to download and print the materials on this web site for personal, non-commercial use only, and to display it on your personal computer provided you do not modify the materials and that you retain all copyright notices contained in the materials. By downloading content from our website, you accept the terms of this agreement.


Presentation Transcript

1 Introduction Service availability measured in “nines” relates to the amount of time (per year) Service Level Uptime per Downtime per 90% 328.50 days 52.56 minutes 99.999% ~365 days 5.26 minutes 99.9999% ~365 days 31.54 seconds Availability of a system is defined as the probability that a system is available [1]. There are many gaps in this definition, lable to an operat-ing system, yet if the network cable is unplugged, can we really say the system is available? What if the local router is down? Obviously, system availability end-to-end definition such as in [2]: One has low availability, is there even a need for the service to be highly available? attempt to see the service from the users’ point of view. A simulation was built for 3 Costs Costs are associated with both ensuring a service level and as a result of service downtime. As the level of service or the the cost increases, and vice versa. Down-time costs can be enormous, downtime for a NYC retail stockbroker for exam-ple could be as high as $6.5 million per illion per to the two cost models. Downtime Costs Costs associated with service downtime can be categorized by causation: direct loss of income, or damages due to a table 2, an hour of downtime for eBay loss of $520,000 in income (due to lost Approx. Approx. eBay 4.55 Bil- 520,000 Amazon.com 6.92 Bil- 790,000 Google 6.14 Bil- 701,000 Table 2: Major Internet service providers reported yearly earnings [4,5,6] and the equivalent per hour earnings (assuming ran-dom distribution). Costs due to breach of contract are the compensation (damages) paid to a cus-tomer because the service level agree-ment was breached by the service pro-vider. These damages should offset the customer’s loss of income due to an out- Service Level Costs than three “nines” (especially five or six “nines”), investment has to be made not related resources. On one end of the is placed in an office and is handled by a part time administrator. On the other end of the scale, the same service is provided by a cluster of high-end machines, placed in well-maintained server rooms, supervised by numerous full-time ad-ministrators, in possibly two or more sites, each with redundant ISPs. Natu-salaries and additional infrastructure may be extremely high [7]. ments for dedicated service hosting with five “nines” of availability for under $100 per server a month (~$1000/yr), this paper assumes that the service may be more complex than the standard web-site-oriented services those hosting com-panies provide, and therefore may be a lot more expensive. In order to discuss an optimal service to estimate the costs involved with in-creasing levels of availability. As the main contributor to cost, we can focus our cost model around the manpower, and estimate that we can obtain service at $50/hr. Furthermore, our basic level of availability is three “nines”. Assuming there is relatively little to no mainte-require ten times the hours invested in the previous level. This is the basis for the cost model suggested in the follow- 4 Optimal Service Level ble to develop an economic model that will help in choosing the optimal service level. Assuming thatrational they would try to maximize their profits: Profits = Total Revenues – Total Costs As the service level improves, total reve-obtaining the improved service level. Because these variables are not inde-pendent, cost minimization can be used instead of profit maximization: Total Cost = Cost of Downtime + Cost of Service Since the cost of downtime decreases as service increases as availability in-creases, the total cost curve (which is the tions) will have a minimum. 99.999.9999.99999.9999Availability Service $ DownTime $ Total $ Figure 1: Choosing an opcost minimization Suppose the average monetary measure of downtime cost is $500,000/hr (a pos-and suppose it is possible to estimate the Cost of Service = 500 / (1-Availability) The result would be a graph similar to this cost model, the optimal choice of that is the point with the minimal cost. Tweaking the model further, if we do not five “nines” would be the optimal choice if the downtime cost goes above optimal choice only when the downtime cost exceeds $58 million/hr. Experiment A simulation was created in order to see the difference in the average impact of a service provider with three “nines” and one with five “nines” on the availability of the clients (all at three “nines”). This was done in order to form a more ‘in-formed’ position – do the service pro- in high availability if their customers have low availability? Availability Availability Server from 99.9% 99.89% 99.99% 99.99% 99.899% 99.999% 99.999% 99.8999% 99.9999% 99.9999% 99.9% 100% 100% 99.9% 100% Table 3: Experiment results 5.4 Analysis As can be seen from table 3, there is a ity of the client due to a service with lower availability. However, from the client’s perspective,and 99.9999% available are marginal (less than 5 minutes per year). Even though the difference from a %99.9 ser-vice is much higher, it boils down to about 50 minutes per year, which is not substantial. 5.5 Improving the Simulation I believe there are at least three flaws in the implementation: The simulation is completely random server side and therefore, the created scenarios do not truly mimic real- number of clients causes the runtime to increase drastically There are no requests, and no levels Regarding the randomness problem, even though the starting point of the downtime itself is random, the length of e is always set to one second. My implementation distrib-utes the downtime randomly across a year and therefore if the total downtime in real life that time may be clustered to onds, while in my implementation those 32 seconds would be randomly distributed across the year the server some set percentage of time per year, but that time is distributed ran-domly over the year, and not in a daily pattern (e.g. 8am-5pm) there is also no support for time zones. Regarding scalability, the random num-since in each simulator second there is a need for two random numbers per client, million seconds in the simulated year, (where n is the number of clients) ran-dom number generations per simulation and thus using a high number of clients tual clients connecting to a server, and only be up or down. Clients can’t meas-ure partial responses, or performance. In future work it might be possible to address these three issues in order to ob-tain results that are closer to the real world runtime environments. 6 Conclusions Based on my experimental results, it would seem that the users of a three slightly lower availability than if the same service had five “nines” of avail- ability (on average 0.01% lower avail-available). This translates to less than heavily used service. From the user’s point of view, this might be acceptable (especially since the user might not see [2]). Therefore, it is my belief that heavily consider the impact of a lower However, as some services (such as in extremely high volumes (i.e. above a amount of availability (even if it is 99.9999%) as long as the cost is mini-mized. References [1] Jim Gray. Why Do Computers About It?, Technical report 85.7, Tandem Computers, Cupertino, [2] Matthew Merzbacher, Dan Pat-Availability on the Web: Practi-cal Experience [3] T. Sweeney. No Time for DOWNTIME — IT managers feel the heat to prevent outages that can cost millions of dollars. InternetWeek n.807, 3 April [4] eBAY INC. Q4-05 Earnings Re- [5] Amazon.com. 2004 Annual Re- [6] Google INC. 2005 Form 10-K [7] W. Sawyer. Case Studies from HP’s 5nines Program: The Cost Availability. HDCC, May 8 th , 2001.