PDF-scores in the CDC growth charts
Author : ellena-manuel | Published Date : 2017-01-11
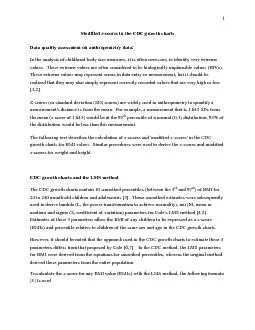
1 Modified z Data quality assessment on anthropometry data In the analysis of childhood body size measures it is often necessary to identify very extreme values
Presentation Embed Code
Download Presentation
Download Presentation The PPT/PDF document "scores in the CDC growth charts" is the property of its rightful owner. Permission is granted to download and print the materials on this website for personal, non-commercial use only, and to display it on your personal computer provided you do not modify the materials and that you retain all copyright notices contained in the materials. By downloading content from our website, you accept the terms of this agreement.
scores in the CDC growth charts: Transcript
Download Rules Of Document
"scores in the CDC growth charts"The content belongs to its owner. You may download and print it for personal use, without modification, and keep all copyright notices. By downloading, you agree to these terms.
Related Documents