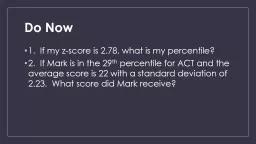
2 If Mark is in the 29 th percentile for ACT and the average score is 22 with a standard deviation of 223 What score did Mark receive Statistics Review Based on the following data set for average GPAs determine ID: 796451
Download The PPT/PDF document "Do Now 1. If my z-score is 2.78, what i..." is the property of its rightful owner. Permission is granted to download and print the materials on this web site for personal, non-commercial use only, and to display it on your personal computer provided you do not modify the materials and that you retain all copyright notices contained in the materials. By downloading content from our website, you accept the terms of this agreement.
Slide1
Do Now
1. If my z-score is 2.78, what is my percentile?
2. If Mark is in the 29
th
percentile for ACT and the average score is 22 with a standard deviation of 2.23. What score did Mark receive?
Slide2Statistics Review
Slide3Based on the following data set for average GPAs, determine
q
uartile 1, quartile 2, and quartile 3.
3.5, 2.5, 3.7, 4.0, 2.1, 1.8, 3.5, 3.2, 4.5
Slide4The z-score 3.1 on a normally distributed measure corresponds to what percentile rank?
Slide5If a distribution has a mean of 78 and the standard deviation is 12, what value would be -2 standard deviations from the mean?
Slide6Which of the following is false about the normal curve.
It is bell shaped
The less data points you have the more normally distributed your curve will be
Mean, median, and mode are the same
If you have a z-score of 0 your score is the average
Slide7What is the mean of the set of data?
37, 42, 56, 98, 42, 12, 15, 62
Slide8Tyler scored in the 66
th
percentile. What was his z-score to the nearest hundredth?
Slide9**Mitch and Mel and are trying to decide whose bench press is more impressive based on male vs. female. Mitch benched 150 pounds and the male average is 130 with a standard deviation of 7. Mel benched 95 pounds and the female average is 85 with a standard deviation of 3. Whose bench press was more impressive? Include your z-scores in your answer.
Slide10Bri’s
z-score on the SAT was -2.46, what percentile was she in?
Slide11If all 1,200 students of Long Branch took an achievement test, how many scored lower than the 75
th
percentile?
Slide12**Trevor’s score on his Stats Quiz was at the 60
th
percentile. The grades were normally distributed. The exam average was 75 and the standard deviation was 3. What was Trevor’s score?
Slide13What percentage of scores will fall between 0 and +3 standard deviations in the normal distribution?
Slide14Lindsey wants to study how many people at Long Branch High School support the arts.
The first sample was made up of 100 people Lindsey randomly chosen in the hallway between periods.
The second sample was made up of 150 people attending the school play.
Which sample best fulfills the purpose of the survey and why?
Slide15Eli wanted to study who Long Branch students have failed a class
He created a survey question asking students for their name, grade level and how many classes they have failed.
He made sure to ask an equal number of girls as boys.
He went to 10 classes on different floors to make sure he asked different grade levels
Which step or steps did Eli add bias to his sample?
Slide16Maria surveyed 450 residents of Long Branch about how much they spend at the grocery store per week. The mean of the sample was $125 with a standard deviation of $9.60. Maria can be 95% confident that the mean amount of money spent at the grocery store for all Long Branch residents is $125 with what margin of error.
(Use the formula
)
Chris wants to record how fast track athletes can run around the track. The average time was 55 seconds. What type of study did Chris conduct?
Slide18Marcus wants to study how sleep effects grades. He asked 5 of his classmates to get 5 hours of sleep each night for a week and 5 of his other classmates to get 8 hours of sleep each night for a week. He gave them a test at the end of the week to see if sleep affected their scores on the test. What type of study did Marcus conduct?
Slide19**Sierra scored in the 97
th
percentile on an PSAT last year. The test scores were normally distributed with an average of 620 and a standard deviation of 45. What was Sierra’s score?
Slide20What percentage of scores fall between -2 and +2 standard deviations in the normal distribution?
Slide21If a distribution has a mean of 12 and the standard deviation is 2.8, what value would be +3 standard deviations from the mean?
Slide22Period A1’s class average for Statistics quiz 1 was 93% and the standard deviation was 3.45. If
Davi
scored a 95%, what was his z-score?