PPT-Chapters 2 and 3 : Frequency Distributions, Histograms,
Author : lindy-dunigan | Published Date : 2016-04-19
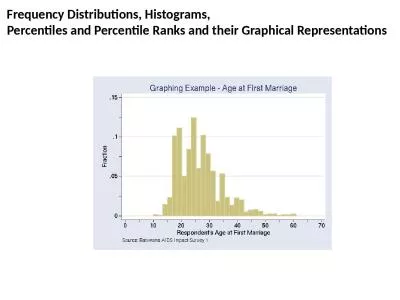
Percentiles and Percentile Ranks and their Graphical Representations Note well be skipping book sections 24 apparent and real limits 28 29 percentile and percentile
Presentation Embed Code
Download Presentation
Download Presentation The PPT/PDF document "Chapters 2 and 3 : Frequency Distributio..." is the property of its rightful owner. Permission is granted to download and print the materials on this website for personal, non-commercial use only, and to display it on your personal computer provided you do not modify the materials and that you retain all copyright notices contained in the materials. By downloading content from our website, you accept the terms of this agreement.
Chapters 2 and 3 : Frequency Distributions, Histograms,: Transcript
Download Rules Of Document
"Chapters 2 and 3 : Frequency Distributions, Histograms,"The content belongs to its owner. You may download and print it for personal use, without modification, and keep all copyright notices. By downloading, you agree to these terms.
Related Documents